Data Visualization
Using ggplot2
Visual Appearance
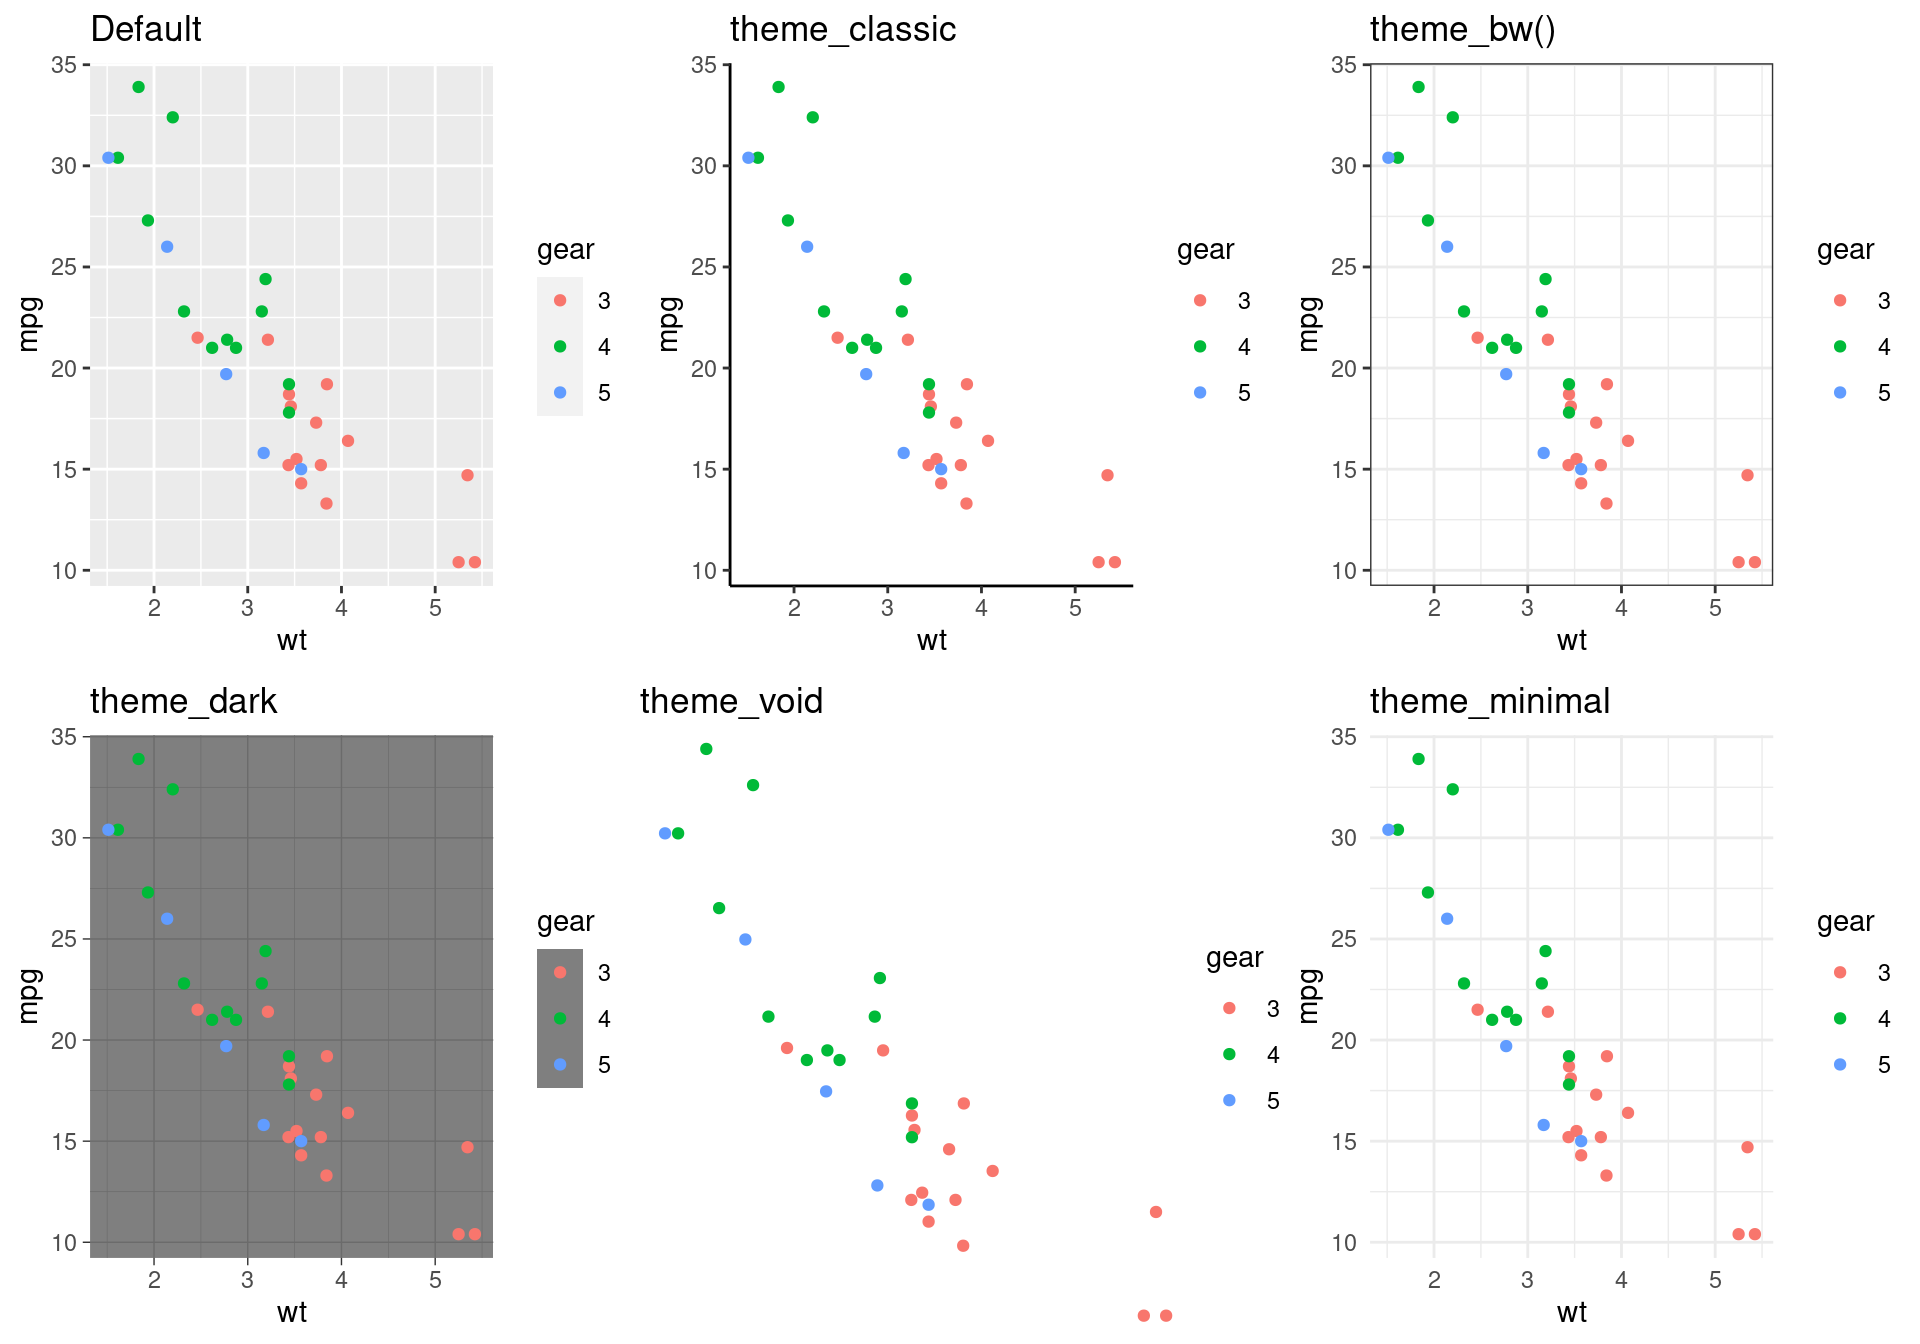
Built-In Themes
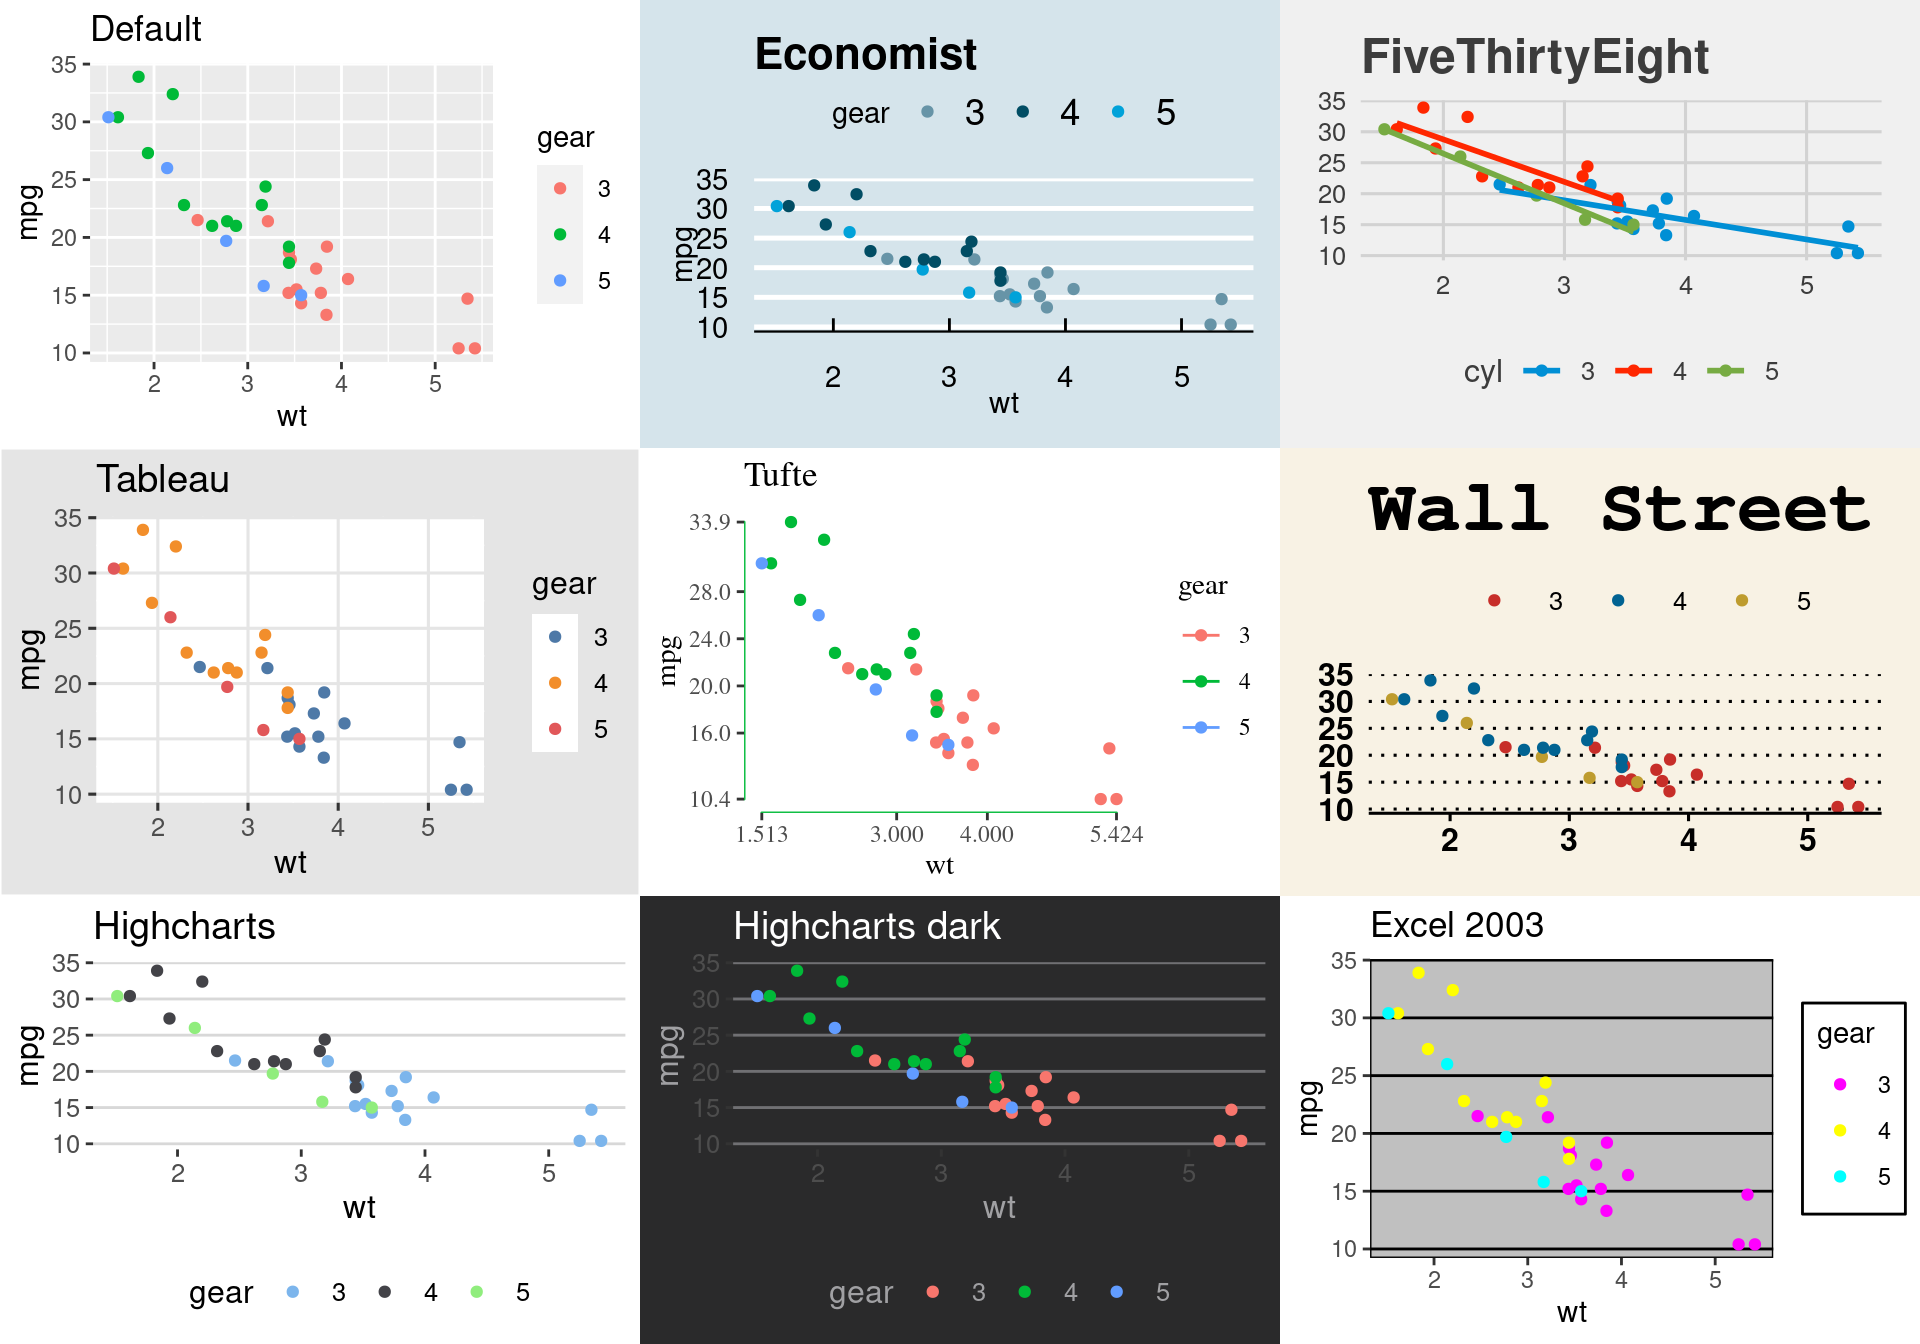
Other Themes: ggthemes a ggplot2 extension
Setting Themes
You can globally set a theme with the theme_set() function:
Modifying a plot
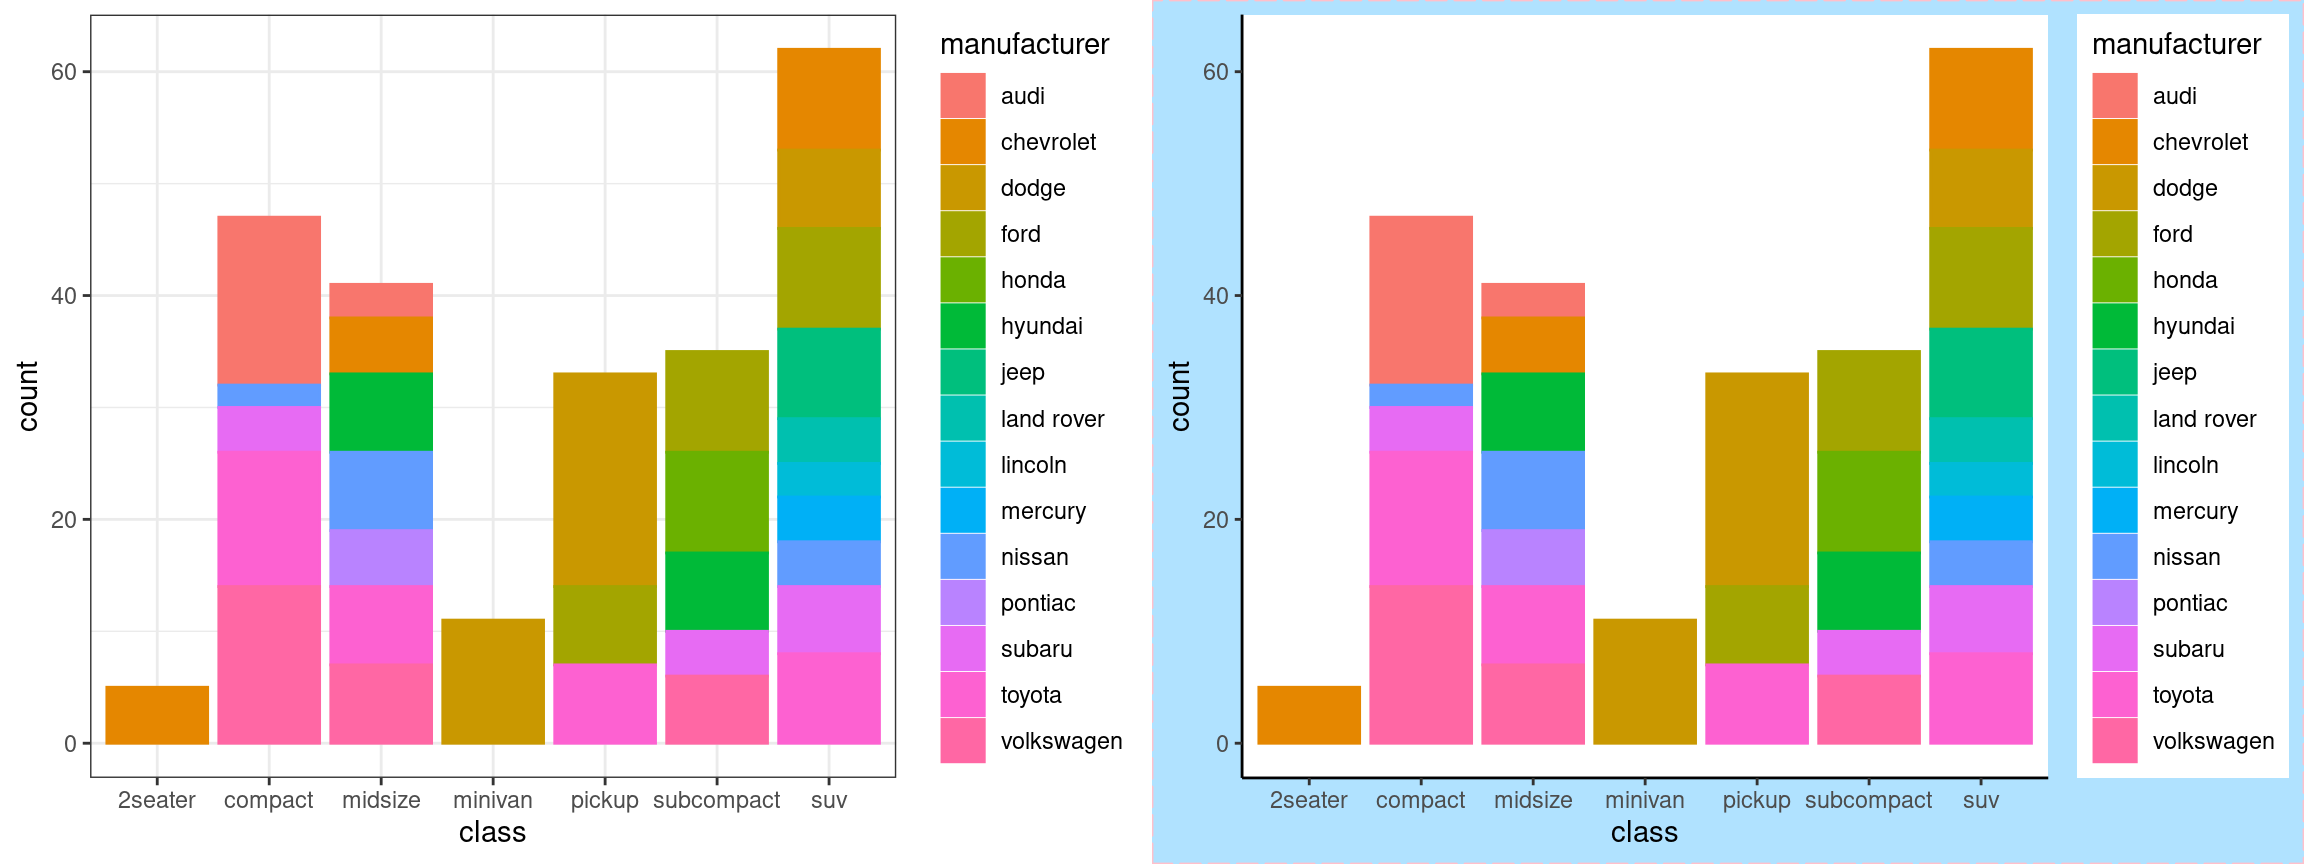
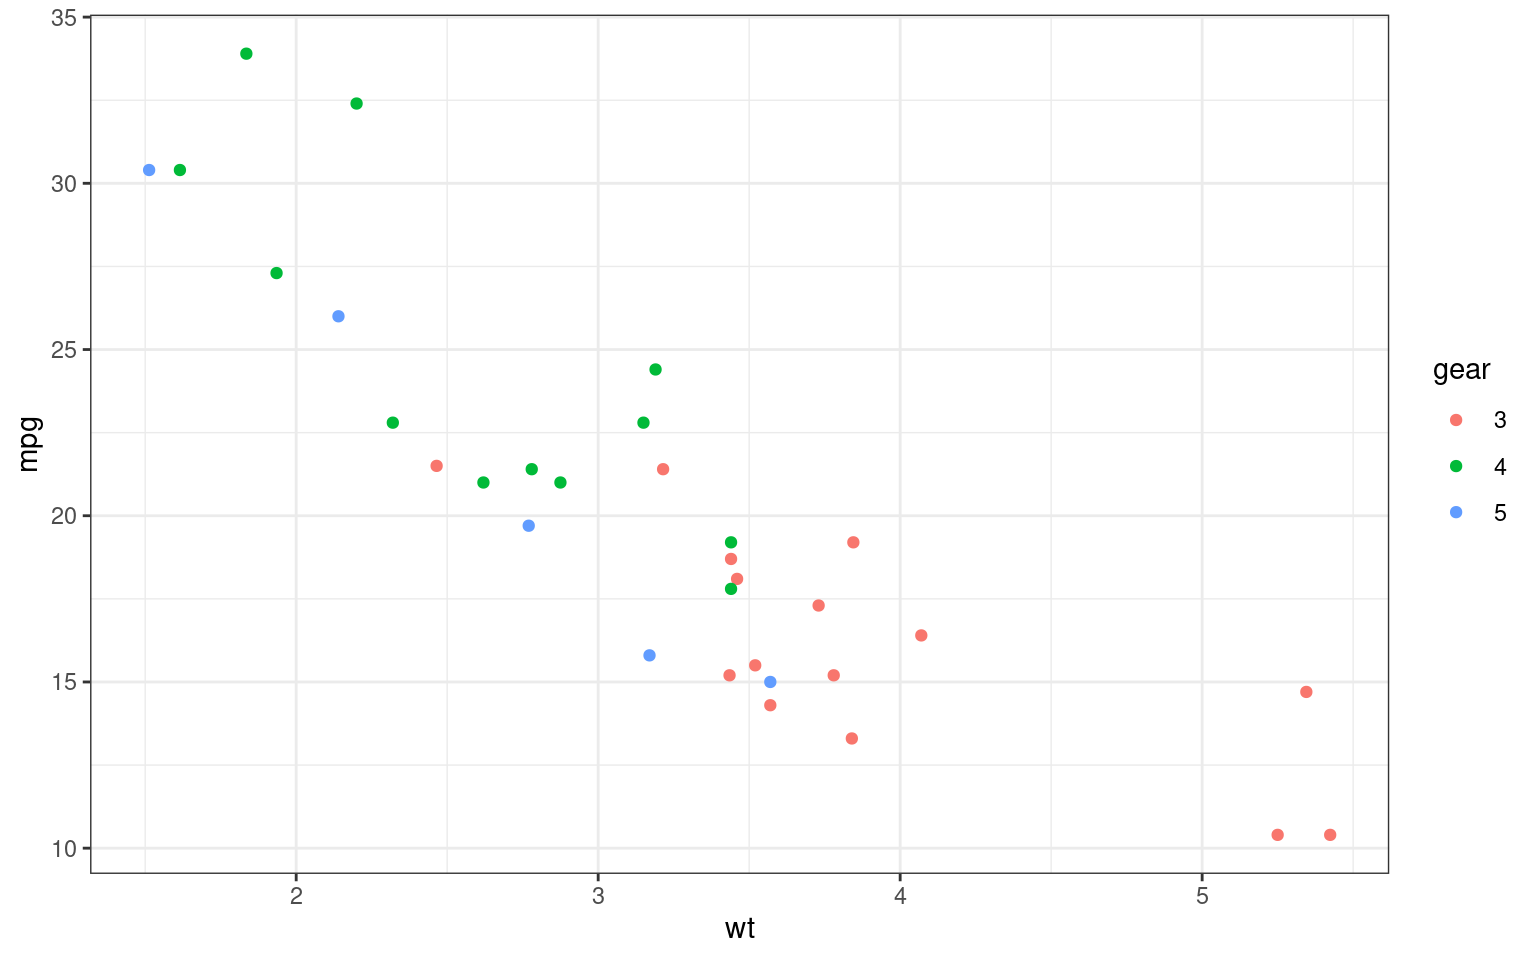
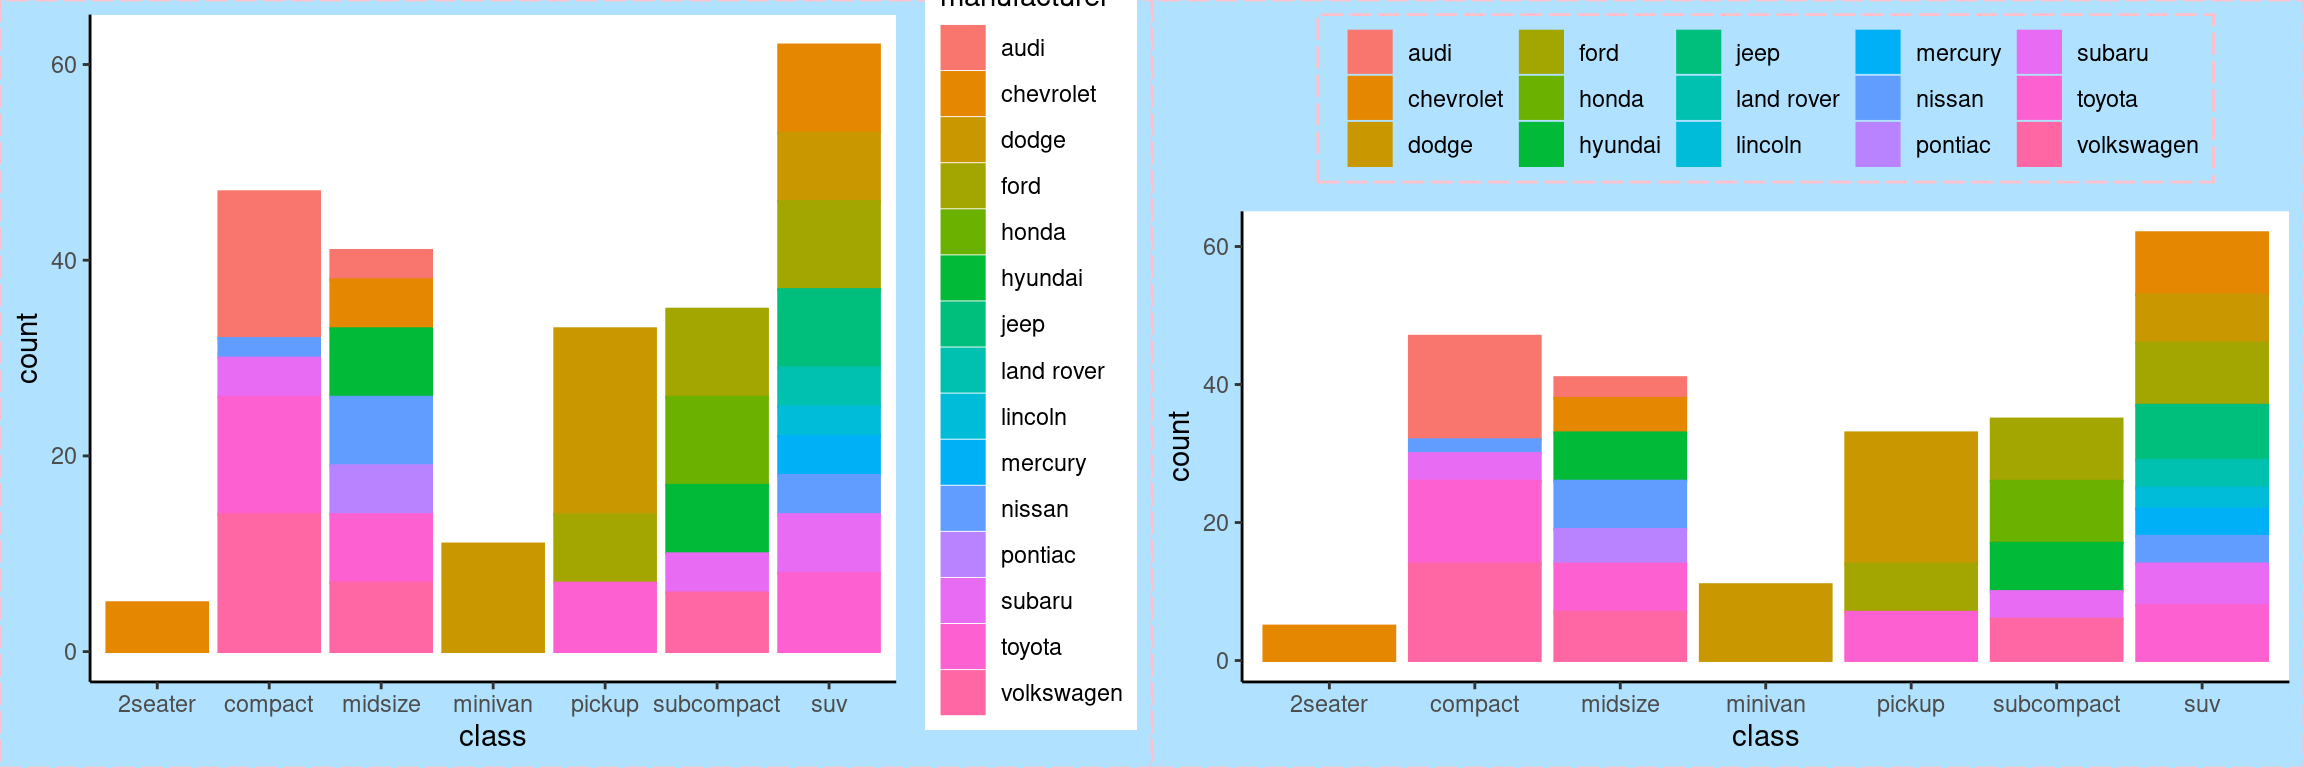
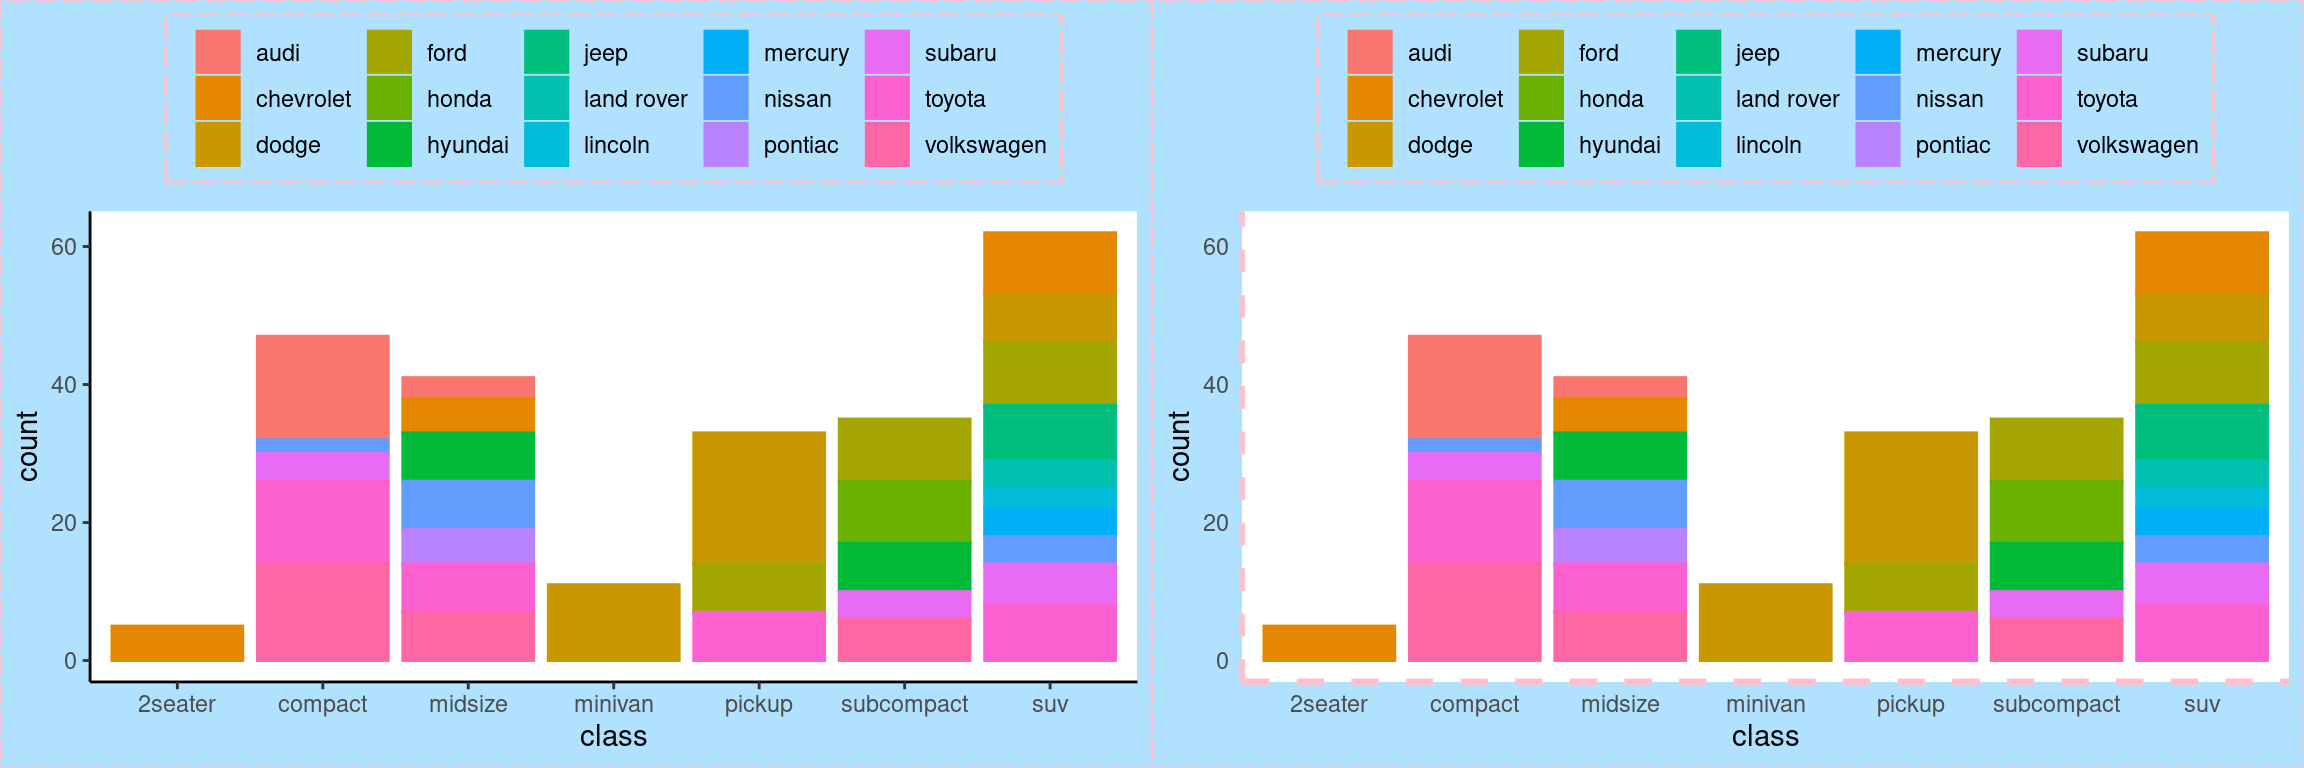
Plot Legends
p3 <- p2 +
  theme(
  ### move and modify legend
  legend.title = element_blank(), #<<
  legend.position = "top", #<<
  legend.key = element_rect(fill = "lightskyblue1", color = "lightskyblue1"), #<<
  legend.background = element_rect( fill = "lightskyblue1",color = "pink", size = 0.5,linetype = "longdash") #<<
  )
Modifying Axes
Plot Labels
Can be modified in several ways: - labs(), xlab(), ylab(), ggtitle() - You can also set axis and legend labels in the individual scales (using the first argument, the name) e.g. scale_x_continuous() .

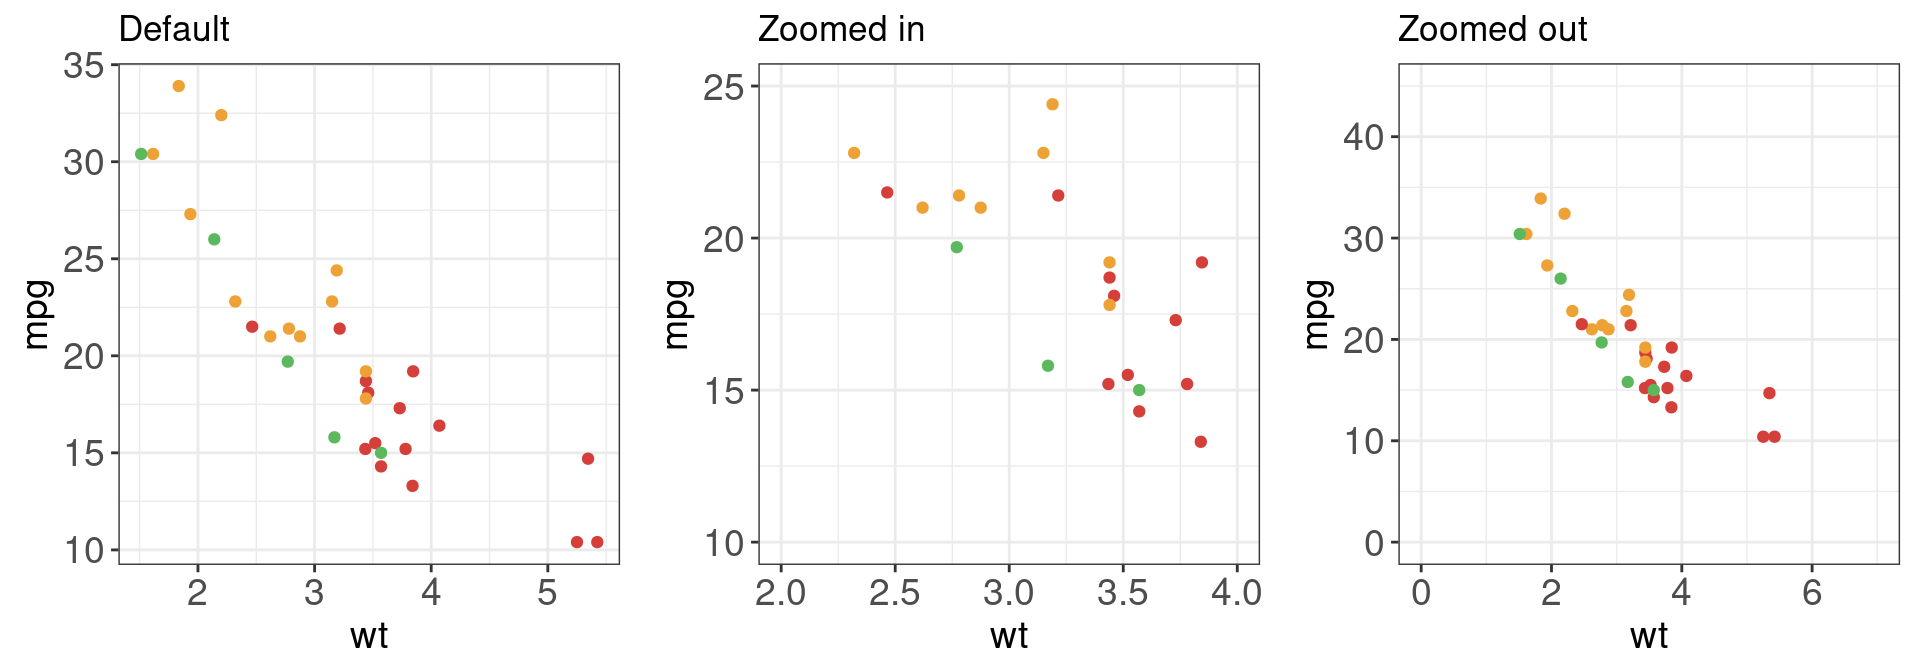
Zooming