Introduction to Statistical Modeling
Outline
What is statistical modeling?
Observational Studies vs Planned Experiments
Data Format
Exploratory Data Analysis - why do it?
Content modified from: https://tjfisher19.github.io/introStatModeling/introductory-statistics-in-r.html#goals-of-a-statistical-analysis
Why is statistical analysis important?
The language R is our tool to facilitate investigations into data and the process of making sense of it. This is what the science of statistics is all about.
The goals of a statistical analysis typically are
to make sense of data in the face of uncertainty.
to meaningfully describe the patterns of variation in collected sample data, and use this information to make reliable inferences/generalizations about the parent population.
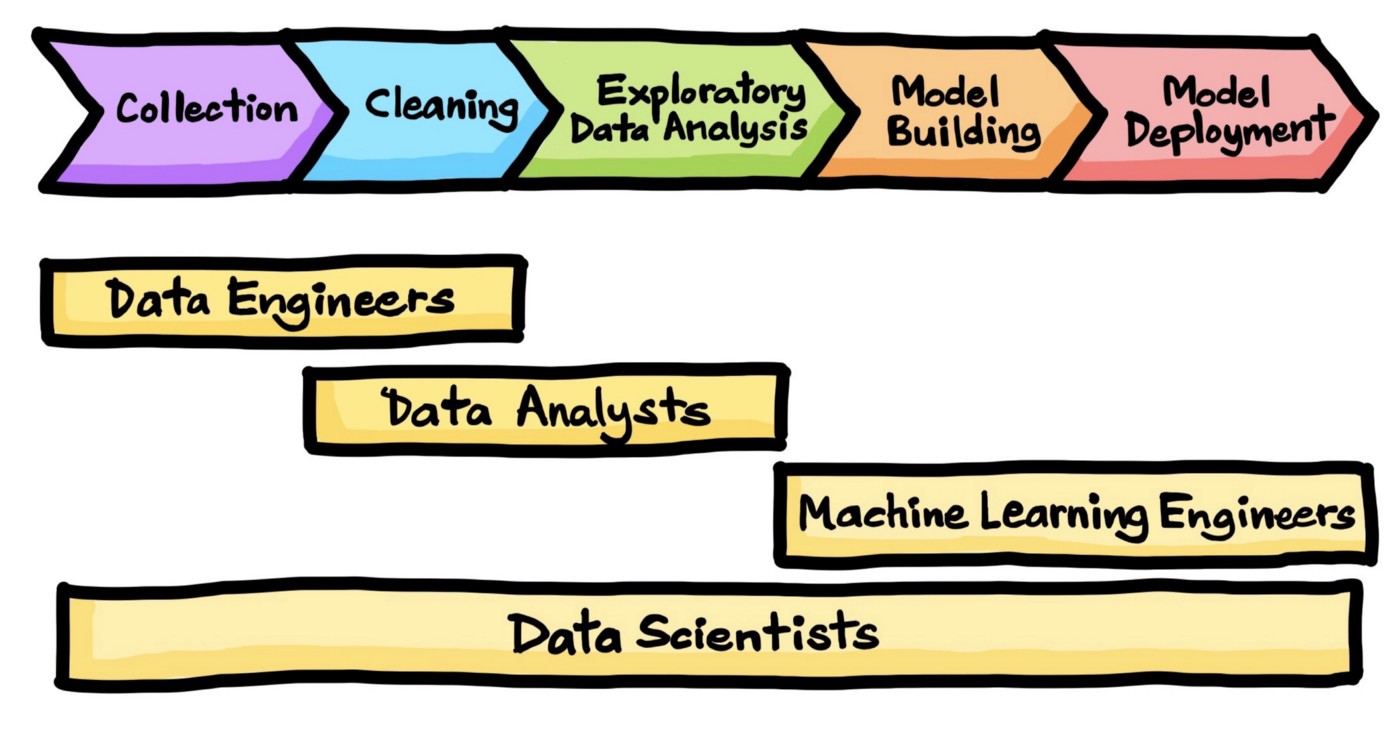
Data science process

Image source: https://towardsdatascience.com/the-data-science-process-a19eb7ebc41b?gi=10ee5878828e
Data collection
What is the source of your data? How was the data collected?
Observational Studies
simply collect measurements on predictor and response variables as they naturally occur.
no intervention from the data collector.
cannot establish causal connections
e.g. the natural resources department is interested in the relationship between the water quality and the distance from the nearest power plant.
Planned Experiments
a researcher manipulates one or more variables, while holding all other variables constant
we can establish cause and effect relationships between the predictors and response
e.g. an agronomy and horticulture grad student applies different types of fertilizer to plots in a corn field and measures the height of the corn plants.
Data cleaning
Recall tidy data format! Specify EVERYTHING (e.g. plot, treatment, pair, response, etc.)
Each variable is a column
Each observation is a row
Each type of observational unit forms a table
Experimental unit vs Sampling unit
In a planned experiment, it is important to know where your treatments were independently applied.
Example:
If you apply different fertilizers to plots in a field and measure the height of 10 corn plants from the middle rows of the plot, where are the treatments applied?
- Experimental unit - plot (fertilizer was independently applied)
- Sampling unit - corn plants (measurements were taken individually on the corn plants)
Options:
- Average your response over your sub samples (e.g. find the average height of the 10 plants)
- Account for sub-sampling in your statistical model.
Do not treat each sub-sample as an independent unit in your analysis.
Exploratory Data Analysis (EDA)
Typically referred to looking at descriptive statistics. EDA should be performed prior to a formal analysis (“look at your data first!”)
Numerical summaries
means, medians, standard deviation
quantiles, five-number summaries
correlations
Graphical Summaries
One variable: boxplots, histograms, density plots, etc.
Two variables: scatterplots, side-by-side boxplots, overlaid density plots
Many variables: scatterplot matrices, interactive graphics, faceting
Remember, what you put into your statistical model, you get out of your statistical model. Data quality is important!
EDA Example
Recall the Palmer Penguin data set.
| species | island | bill_length_mm | bill_depth_mm | flipper_length_mm | body_mass_g | sex | year |
|---|---|---|---|---|---|---|---|
| Adelie | Torgersen | 39.1 | 18.7 | 181 | 3750 | male | 2007 |
| Adelie | Torgersen | 39.5 | 17.4 | 186 | 3800 | female | 2007 |
| Gentoo | Biscoe | 48.4 | 14.4 | 203 | 4625 | female | 2009 |
| Gentoo | Biscoe | 51.1 | 16.5 | 225 | 5250 | male | 2009 |
| Chinstrap | Dream | 50.6 | 19.4 | 193 | 3800 | male | 2007 |
| Chinstrap | Dream | 46.7 | 17.9 | 195 | 3300 | female | 2007 |
Data were collected and made available by Dr. Kristen Gorman and the Palmer Station, Antarctica LTER, a member of the Long Term Ecological Research Network.
EDA Example: Numerical summaries
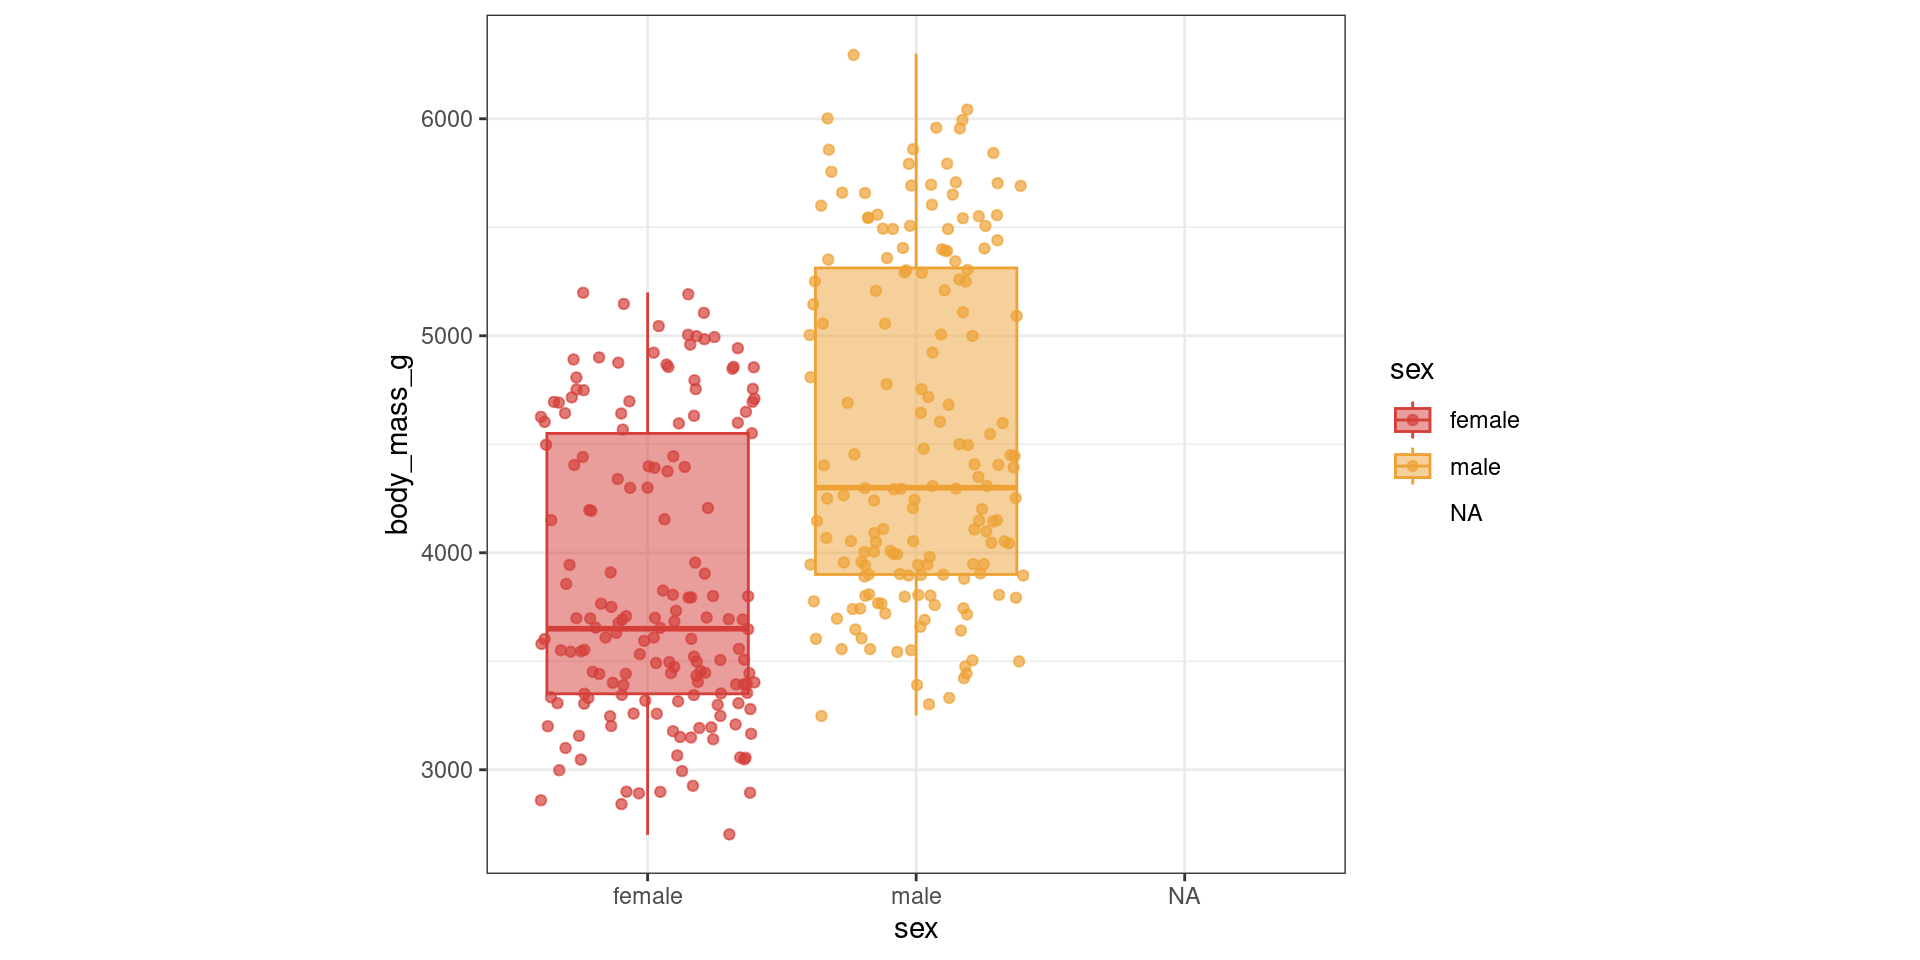
| sex | body_mass_g_Mean | body_mass_g_SD | body_mass_g_Min | body_mass_g_Median | body_mass_g_Max |
|---|---|---|---|---|---|
| female | 3862.3 | 666.2 | 2700 | 3650 | 5200 |
| male | 4545.7 | 787.6 | 3250 | 4300 | 6300 |
| NA | 4005.6 | 679.4 | 2975 | 4100 | 4875 |
Your turn:
+ What if you wanted to get summaries by species instead of sex? What about by both?
+ Can you get summaries for a different measure?
EDA Example: Graphical summaries

Your turn
How would you look at the graphical summary for each species?
What type of plot would you make to compare body mass and flipper length?
Statistical Models
A statistical model is a mechanism we will use to try to describe the structural relationship between some measured outcome (called the response variable) and one or more impacting variables (called predictor variables or factors or features, depending on the contextual circumstance) in a simplified mathematical way.
\[ \text{Data} = \text{Systematic Structure} + \text{Random Variation} \]
In this session we will…
- Basic statistical tests
- Five step hypothesis procedure
- confidence intervals & p-values
- t-tests, chi-square tests, and simple regression
- Linear models
- One-way and two-way ANOVA
- Blocking
- Generalized Linear Models
- Poisson and binomial response variables
- Workshop time: bring your own data!
- We will have example data sets for you to practice.