Workshop
Bring your own data!
Palmer Penguins (ANOVA)
Are there differences in any of the measures (bill width, bill depth, flipper length, body mass) between the three species? Can you also account for the sex of the penguin?

Production
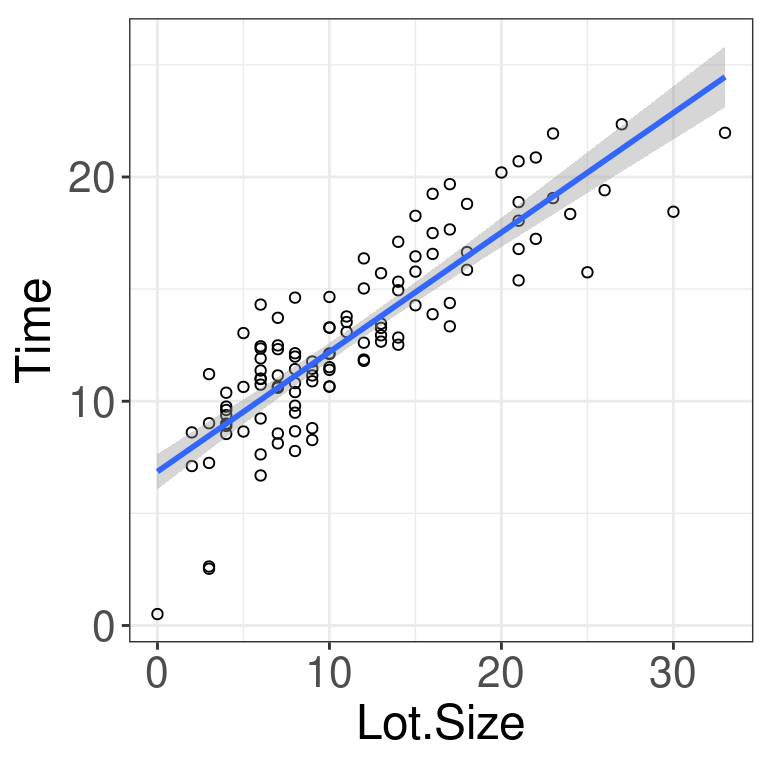
In a manufacturing study, the production times for 111 recent production runs were obtained. The researchers are curious if the production lot size can predict the production time in hours.
| Lot.Size | Time |
|---|---|
| 15 | 14.28 |
| 9 | 8.80 |
| 7 | 12.49 |
| 4 | 9.38 |
| 9 | 10.89 |
| 21 | 15.39 |

Palmer Penguins (Regression Extention)
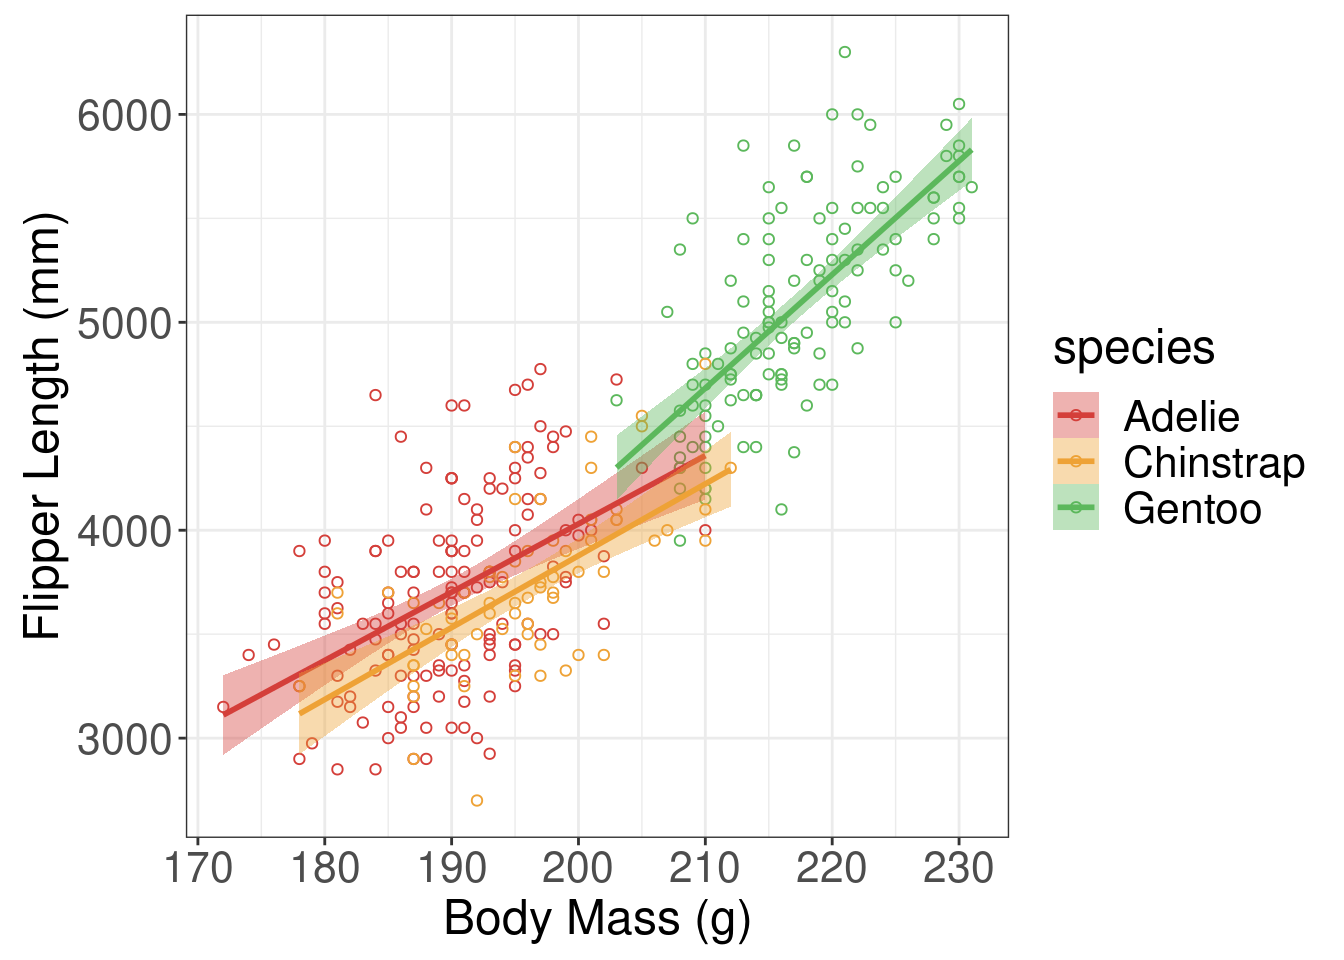
What if you wanted to fit a linear regression line between bill length and bill depth for each species?

Environmental Condition
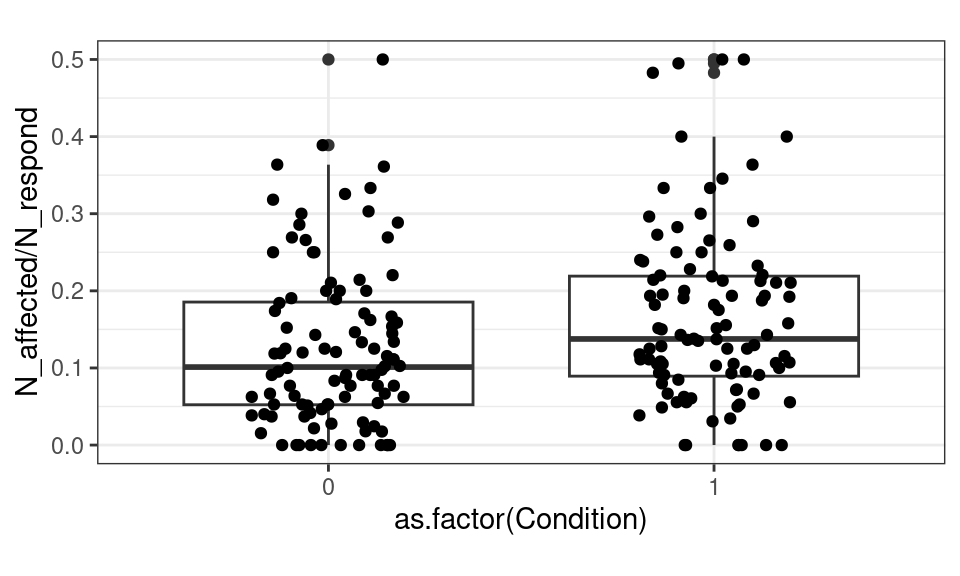
Here’s the big picture: there is an environmental condition suspected of causing increased incidence of a certain medical disorder. To assess the suspected link, 100 clusters are randomly selected where the environmental condition does not exist (coded “Condition = 0”) in the data set) and 100 clusters are randomly selected where the environmental condition does exist (coded “Condition = 1”). All households at each site are sent a survey (in survey design, this is called cluster sampling) – response is voluntary.
| Cluster | Condition | N_respond | N_affected |
|---|---|---|---|
| 1 | 0 | 23 | 2 |
| 2 | 0 | 25 | 3 |
| 3 | 0 | 26 | 7 |
| 4 | 0 | 9 | 3 |
