Introduction to Graphics
We read…
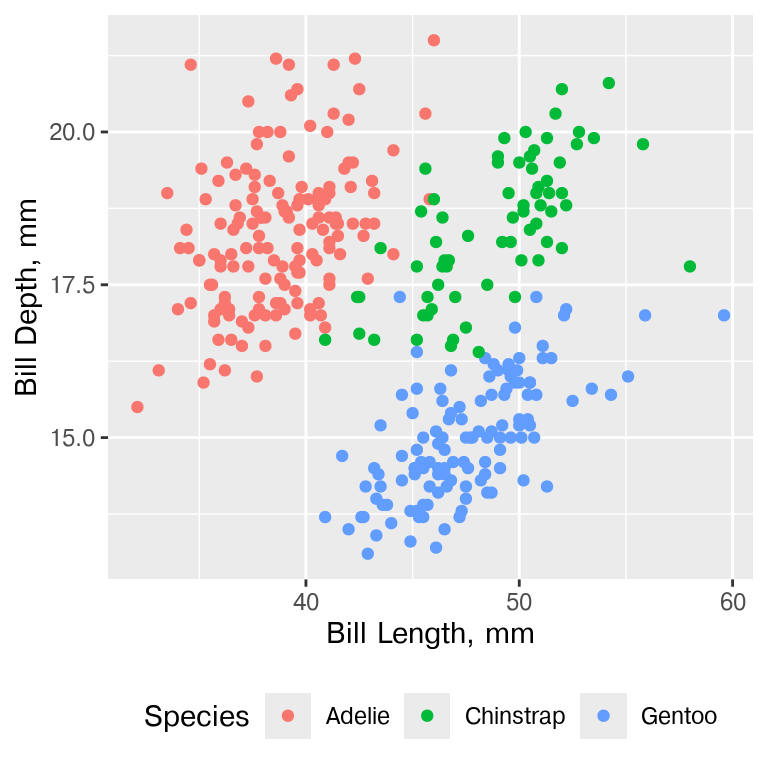
Practice
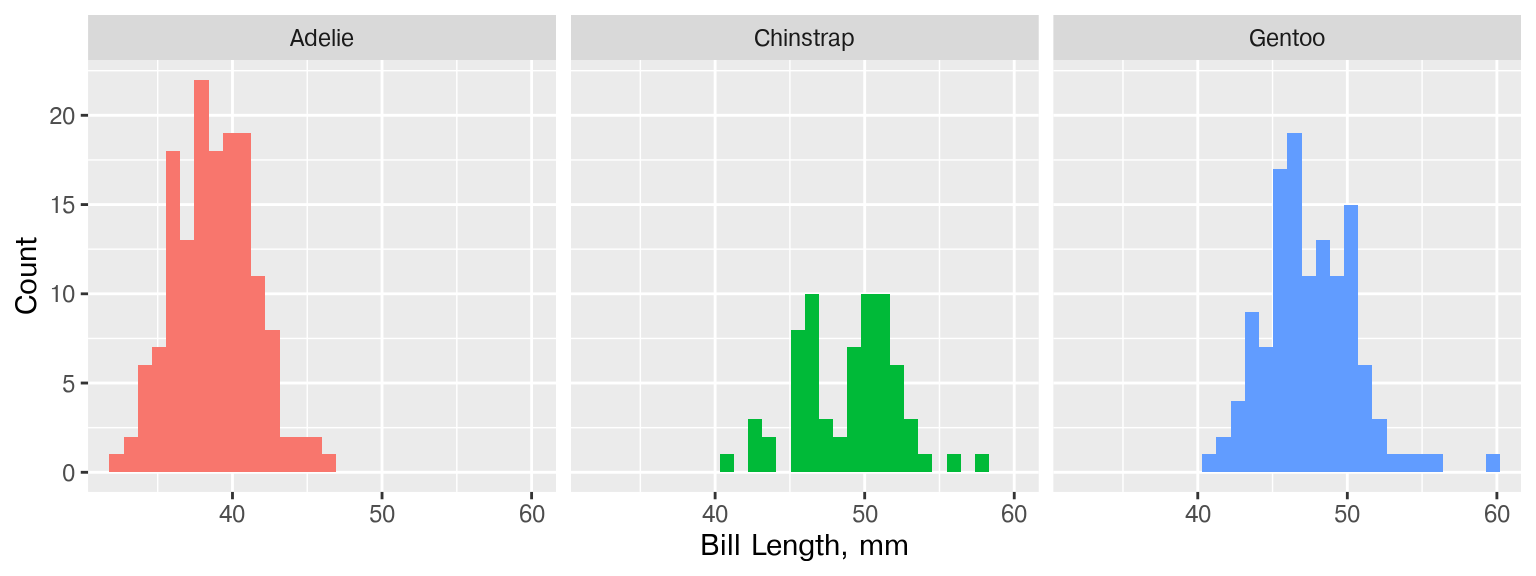
- What type of plot is it?
- Which variables are mapped to x, y, and fill?
- What is the main message of the plot: what is your main finding, i.e. what do you want viewers to learn from the plot?
- Are there any anomalies or outliers?
- (Extra question) Could you make this plot more effective? How?