Creating Good Graphics
Reading and Resources
.](images/textbook-good-graphics.png)
Other useful things:
.]()
Seaborn cheat sheet
.](images/seaborn-cheat-sheet.png)
Motivation and Inspiration
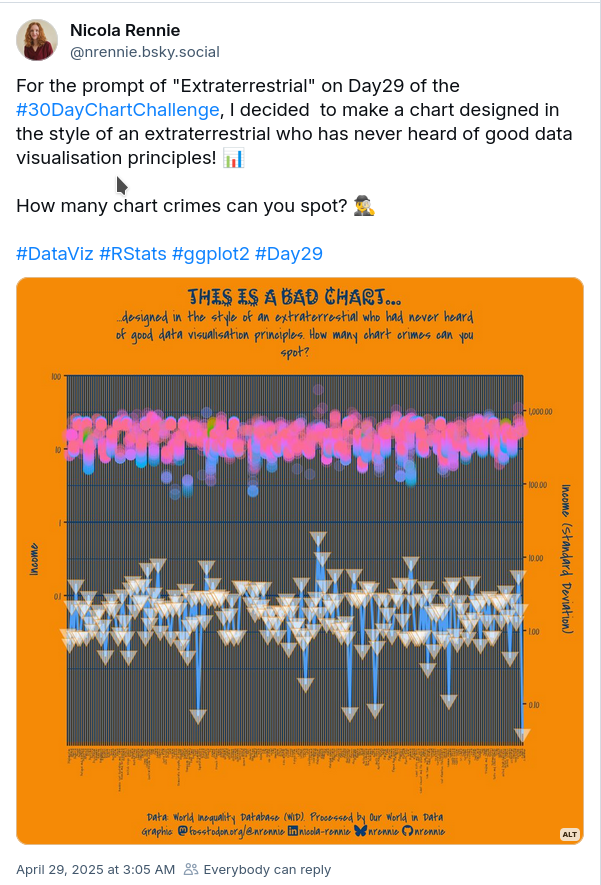
- fonts are unreadable (and don’t match!)
- why use an orange background?? sub-optimal color contrast
- dual y-axis
- log scales on both y axes
- plotting the standard deviation (not ideal)
- x-axis labels aren’t legible
- x-axis gridlines dominate the whole plot
- x-axis appears to be categorical?
- Line chart (bottom set of data) isn’t appropriate
- scatterplot with categorical x-axis not optimal (sometimes ok)
- Bottom set of data: points make the lines hard to see
- Top set of data (points) have different colors but no legend
- Poor color contrast between some of the point colors
- Can’t tell which set of data goes with which axis
I’m sure there are more…