# code chunk for RMidterm Exam (2026)
Exam
Week07
Accept this assignment through the link in Canvas.
The exam is a comprehensive take-home exam.
Each year, Sandhill Cranes migrate through Nebraska on their way from their Winter areas in the southern US and Mexico to their Summer breeding grounds in Northern Canada, Alaska, and Siberia.
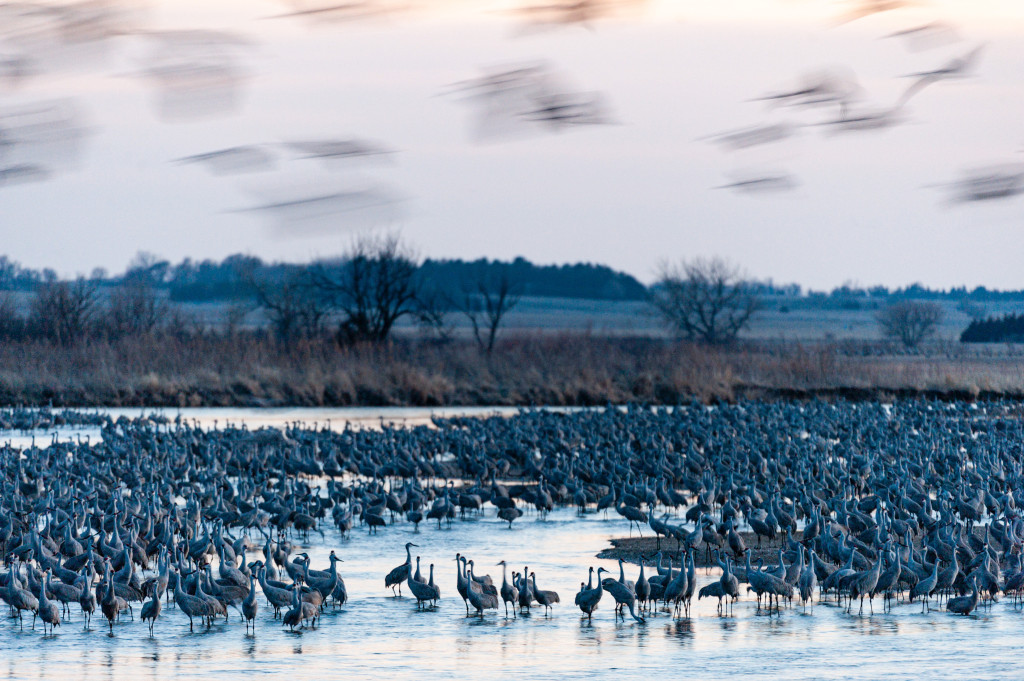
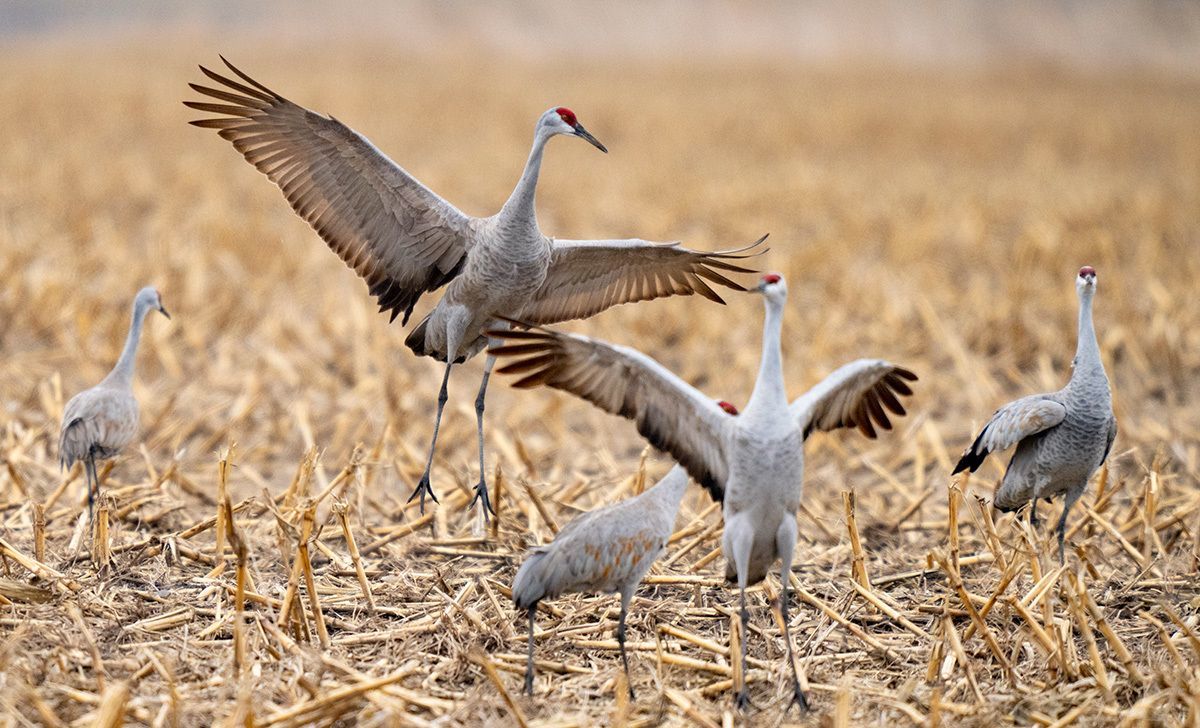
The photographs show Sandhill Cranes migrating through Nebraska.
Can we see this migration in hobbyists’ data? iNaturalist is a non-profit organization that provides an online platform for the users of their app to submit geo-tagged observations of plants and animals and share their findings with researchers and the public.
The file cranes.csv contains results from this platform using the search term “Sandhill Crane”.
While you should not need it for answering the questions here, a description of some of the variables and the data structure is available at the iNaturalist Open Data documentation.
For all of the following questions, provide answers and include your code. You can work in R or in python or in a mix of the two. Make sure that the final document you submit renders without errors. In the rendered document avoid any lengthy output.
1. Read the data (10 points)
Load the data into the object cranes using R or python.
- Make sure that you are working with an object with 10536 rows and 39 columns.
- How many numeric variables, how many text variables does the data set contain? Are there any other types of variables?
# python code chunk2. First overview (20 points)
Answer the following questions and provide the code that allows you to answer the question.
- Which variable has the highest number of missing values? What is the percentage of missing values across all variables?
- How many different users (
user_id) submitted observations? Which user submitted the highest number of observations? - The variable
scientific_namecontains the scientific name of the observed species. Create a summary of the fifteen (sub-)species most frequently observed.
# code chunk for R# python code chunk3. Visual Inspection (25 points)
- “Antigone canadensis” is the scientific name of the Sandhill Crane. How many different scientific names in
scientific_namecontain the substringAntigone canadensis? Create an objectsandhillthat contains only Sandhill Cranes (and their subspecies). - Create visualizations that contain the variables below in a meaningful way. Describe each of the visualizations you create and what you learn about the data they show:
latitude,longitudecontain the geographic latitude and longitudeobserved_ondate on which the observation was madeyear,dayyear and day of the week an observation was madecommon_namecommon name of the observed animal
- Nebraska fails between -104 and -95.3 degrees longitude and 40.0 and 43.0 degrees latitude. Create an object
nebraskathat contains all of the Sandhill Crane observations between these coordinates. How many observations are innebraska? Do the observations follow I-80 or the Platte River more closely? Discuss your answer.
# code chunk for R# python code chunk4. How many days since January 1? (20 Points)
You are asked to write a function days_since (date) that calculates the number of days it has been since January 1st of that year.
Assume that the date is written in the format like “d2020-03-14”, i.e. year, month, and day are given by 4, 2, and 2 digits, respectively. In case the month or the year are single digits, a leading zero is added. The string starts with a ‘d’; the values for year, month, and day are separated by “-”.
Watch out for leap years! February has an extra day in 2020 and in 2024:
| Year | Jan | Feb | Mar | Apr |
|---|---|---|---|---|
| 2019 | 31 | 28 | 31 | 30 |
| 2020 | 31 | 29 | 31 | 30 |
| 2021 | 31 | 28 | 31 | 30 |
| 2022 | 31 | 28 | 31 | 30 |
| 2023 | 31 | 28 | 31 | 30 |
| 2024 | 31 | 29 | 31 | 30 |
| 2025 | 31 | 28 | 31 | 30 |
Test your function: the output from days_since("d2021-04-03") should be 93; days_since("d2024-03-27") should be 87; and days_since("d2025-03-14") should be 73.
Write a detailed list of steps to calculate from the string named
datethe number of days since Jan 1 of the same year.Implement the function
days_sincein R or python.Apply the function
days_sinceto the variableobserved_on_stringin thecranesdata, and find the average number of days since Jan 1 for each of the years.
# R chunk# python chunk5. A time line (25 points)
- Ensure that the variable
observed_onis a date variable. (If you work on R, use thelubridatepackage to convert the variableobserved_onto a date object. If you work in python, use thedatetimepackage.)
Create a data set with the following data summaries:
- a variable
n_obsthat contains the number of observations for each day, - a variable
year_daythat contains the number of days of that year since Jan 1 (in case you can’t get your function from 4 to work, uselubridate::ydayor pandas.dt.dayofyear) - a logical variable
weekendthat isTRUEif the day is a Saturday or a Sunday andFALSEfor a week day.
Create a scatterplot of the number of observations mapped to
y, theyear_dayvariable mapped toxandweekendmapped to the color of the points.Calculate the average number of observations that are made on weekends and on weekdays. Based on the summary statistics and the visual, discuss the statement: on average, there are significantly more observations made during weekends than on weekdays
# R chunk
library(lubridate)
# python chunk
import datetime