It’s Graphics Week!

Stat 251

2026-02-17

Access to Github

The 30 days for the personalized token are up/were up last week …

Remember to extend the token or create a new one (with usethis::create_github_token())

Screenshot of a github user's Settings > Developer Settings > Personal access token > Tokens (classic)

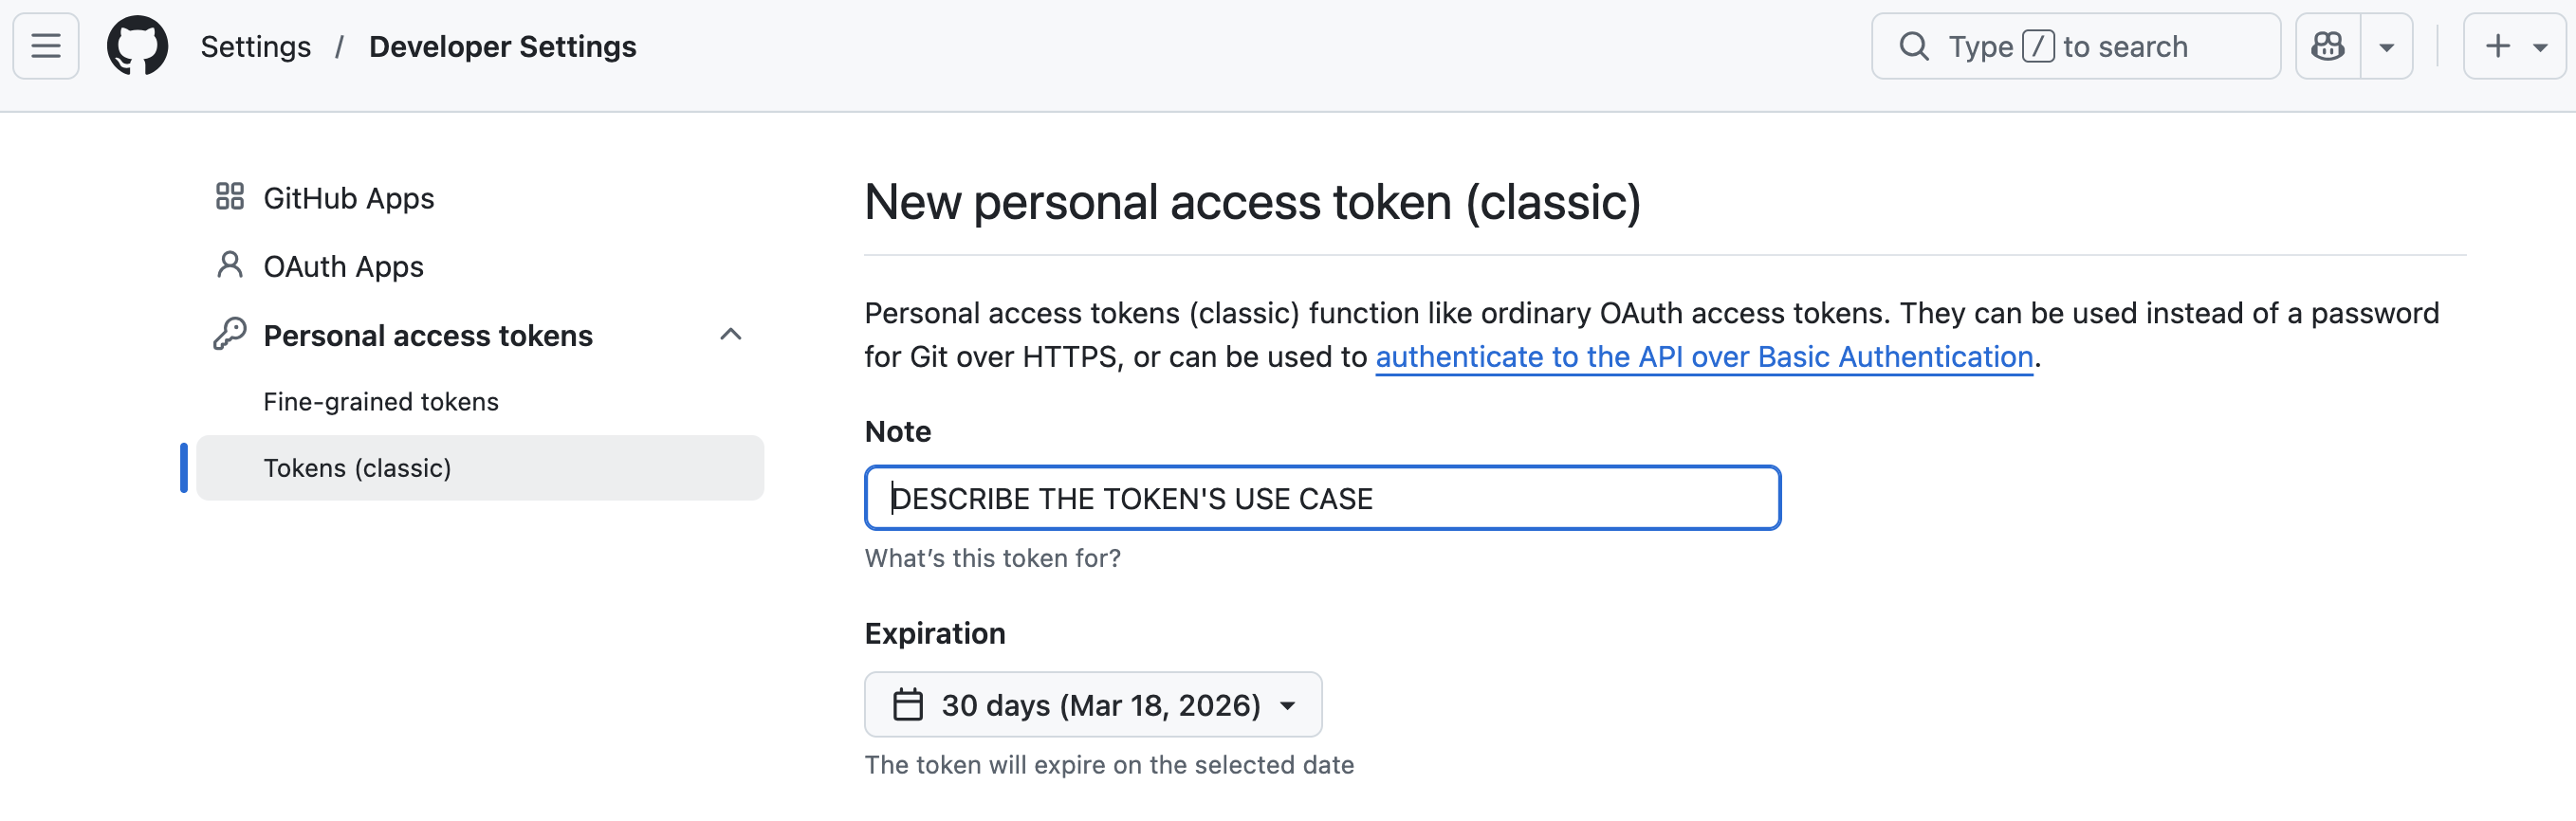
Then follow the instructions of gitcreds::git_set()

Graphics week!

You should have read:

  • Graphics
    • Focus on relationships between variables
    • Grammar of Graphics vs. Manual plot specification/mapping
    • Exploratory data analysis
  • Good Graphics
    • Perception & Cognition
    • Use the least complicated chart that still works

Make Graphics!

  • Part I: Make visual summaries for two new data sets and think about mappings

  • Part II: Use your knowledge to create the worst!

Resources for this week

Homework

  • Explanations! What can you see from the plot? What is its purpose?

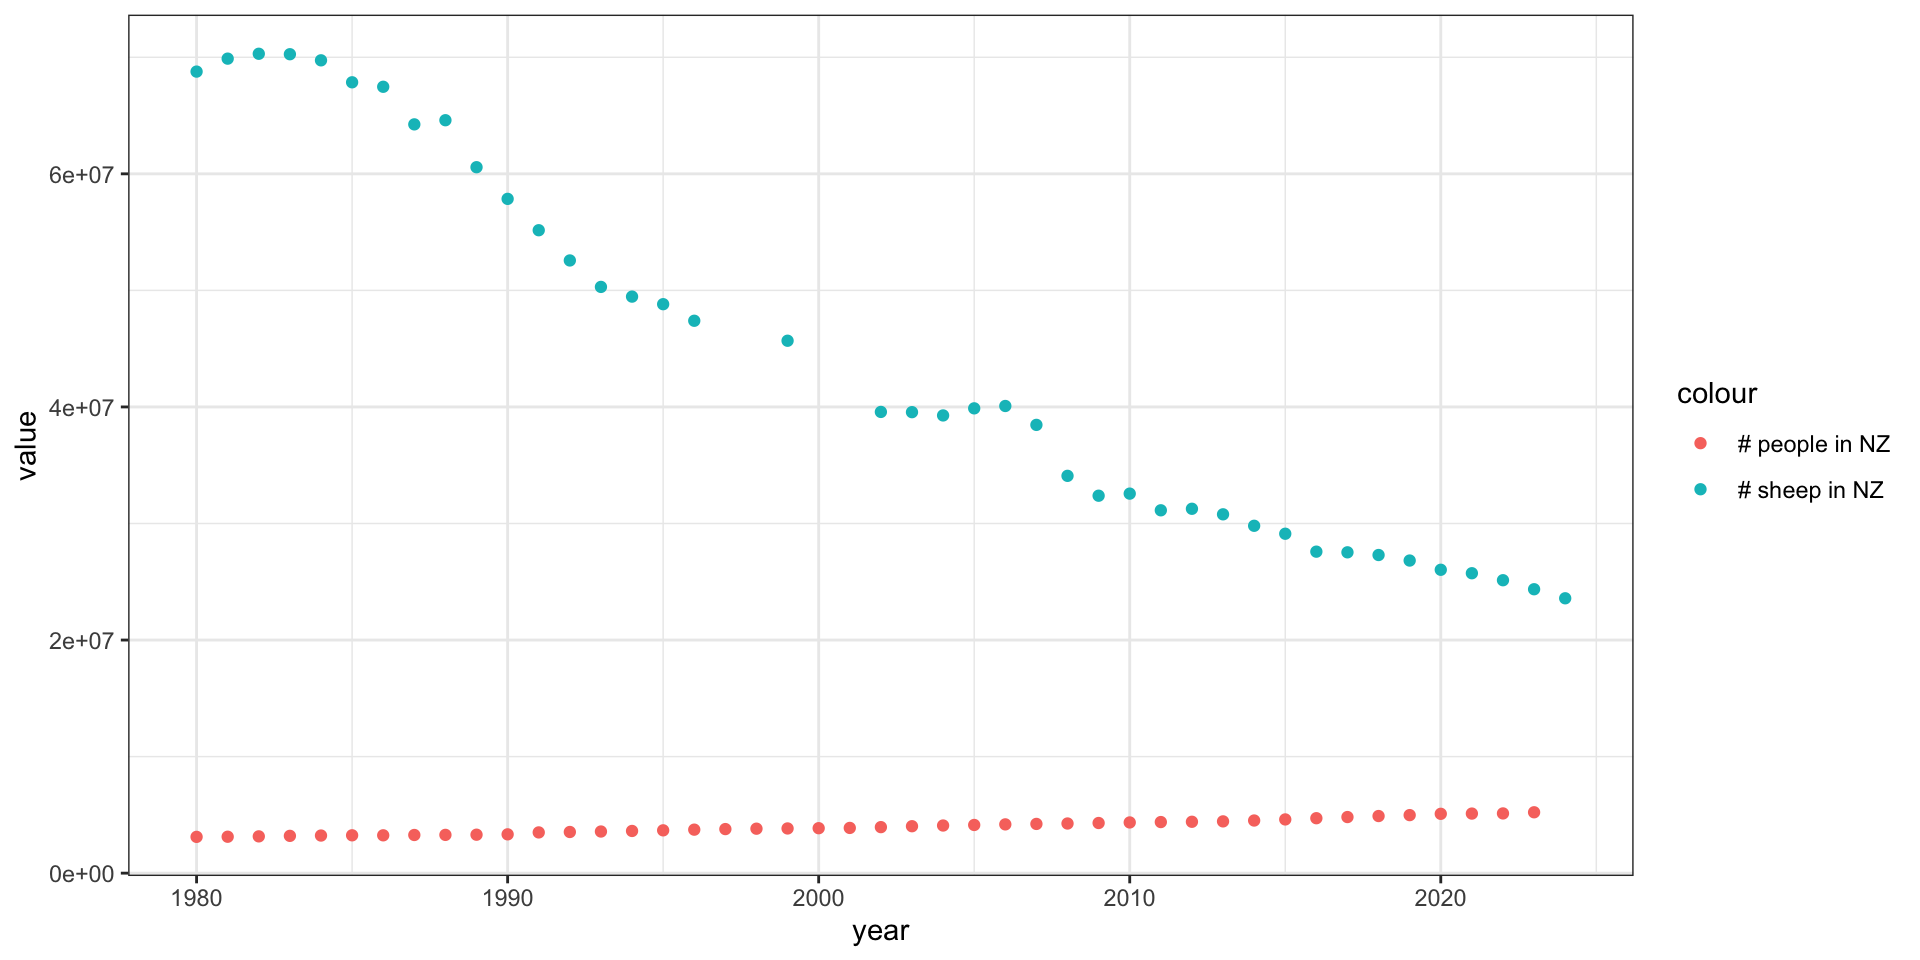
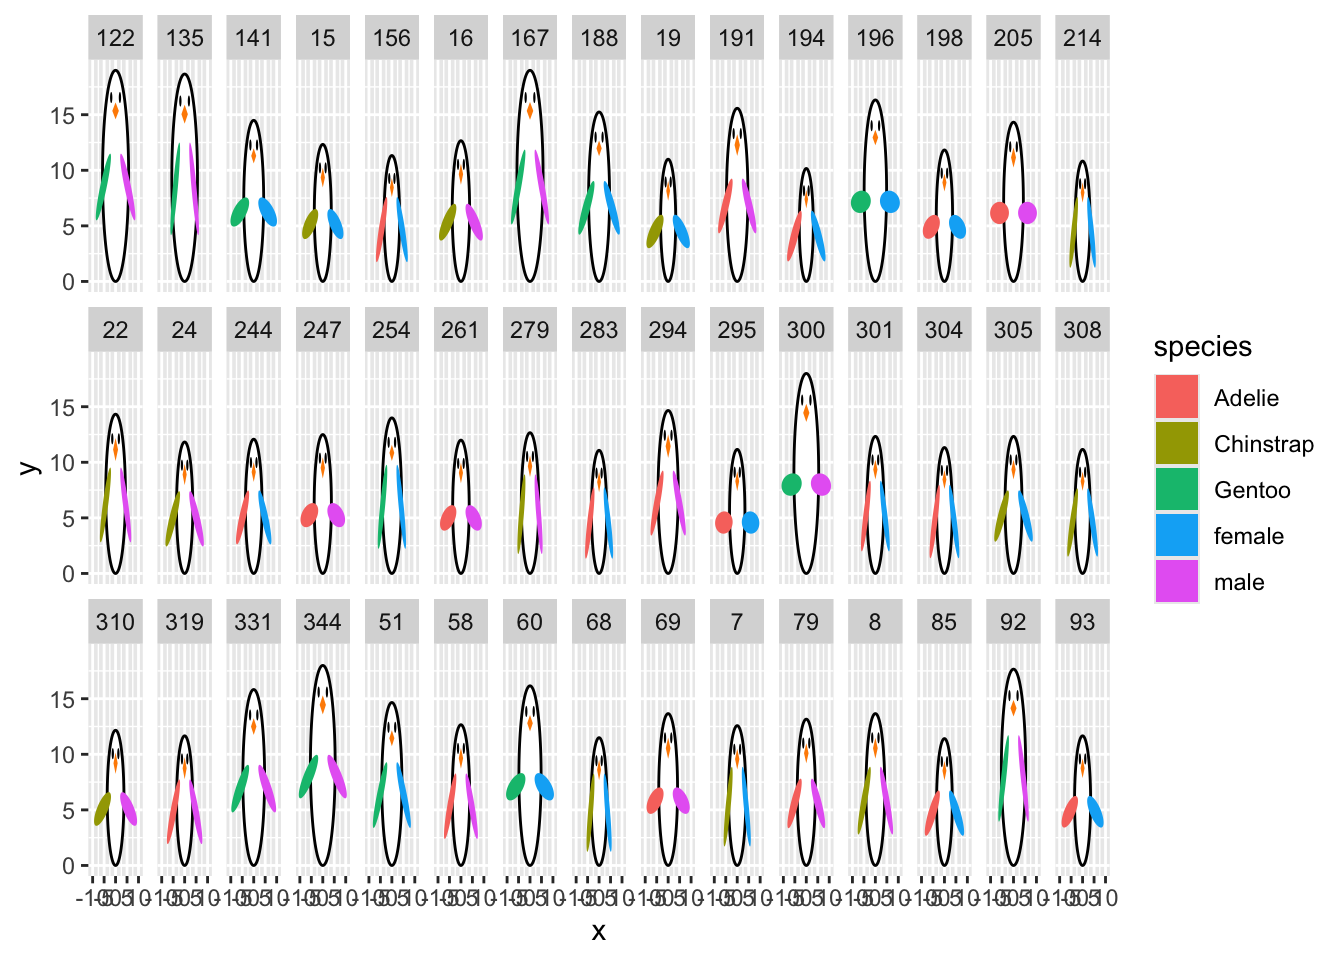
What can you see from this plot?

Does the plot support the message?

“Gap between people and sheep rapidly closing” (March 2025)
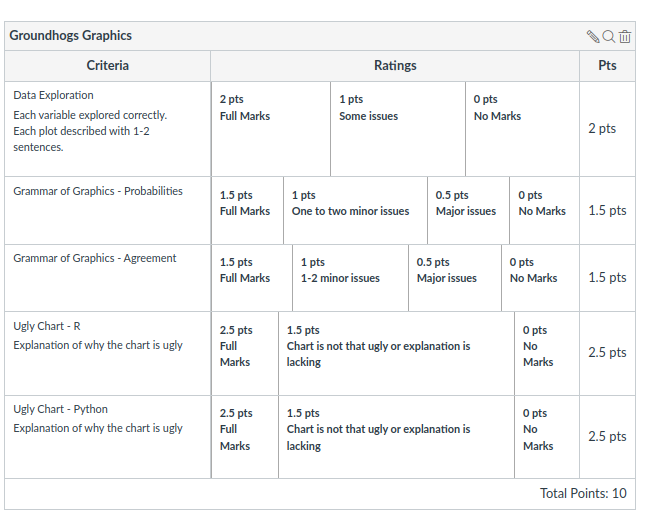
Homework rubric

Rubric for homework assignment. Data exploration is worth 2 points, and includes each variable explored and each plot described with 1-2 sentences. Grammar of graphics - probabilities and grammar of graphics - agreement are worth 1.5 points each. Ugly chart in R is worth 2.5 points, including the explanation of why the chart is ugly. Ugly chart in python is worth 2.5 points, including the explanation of why the chart is ugly.

Next time

  • Continue working on homework assignment