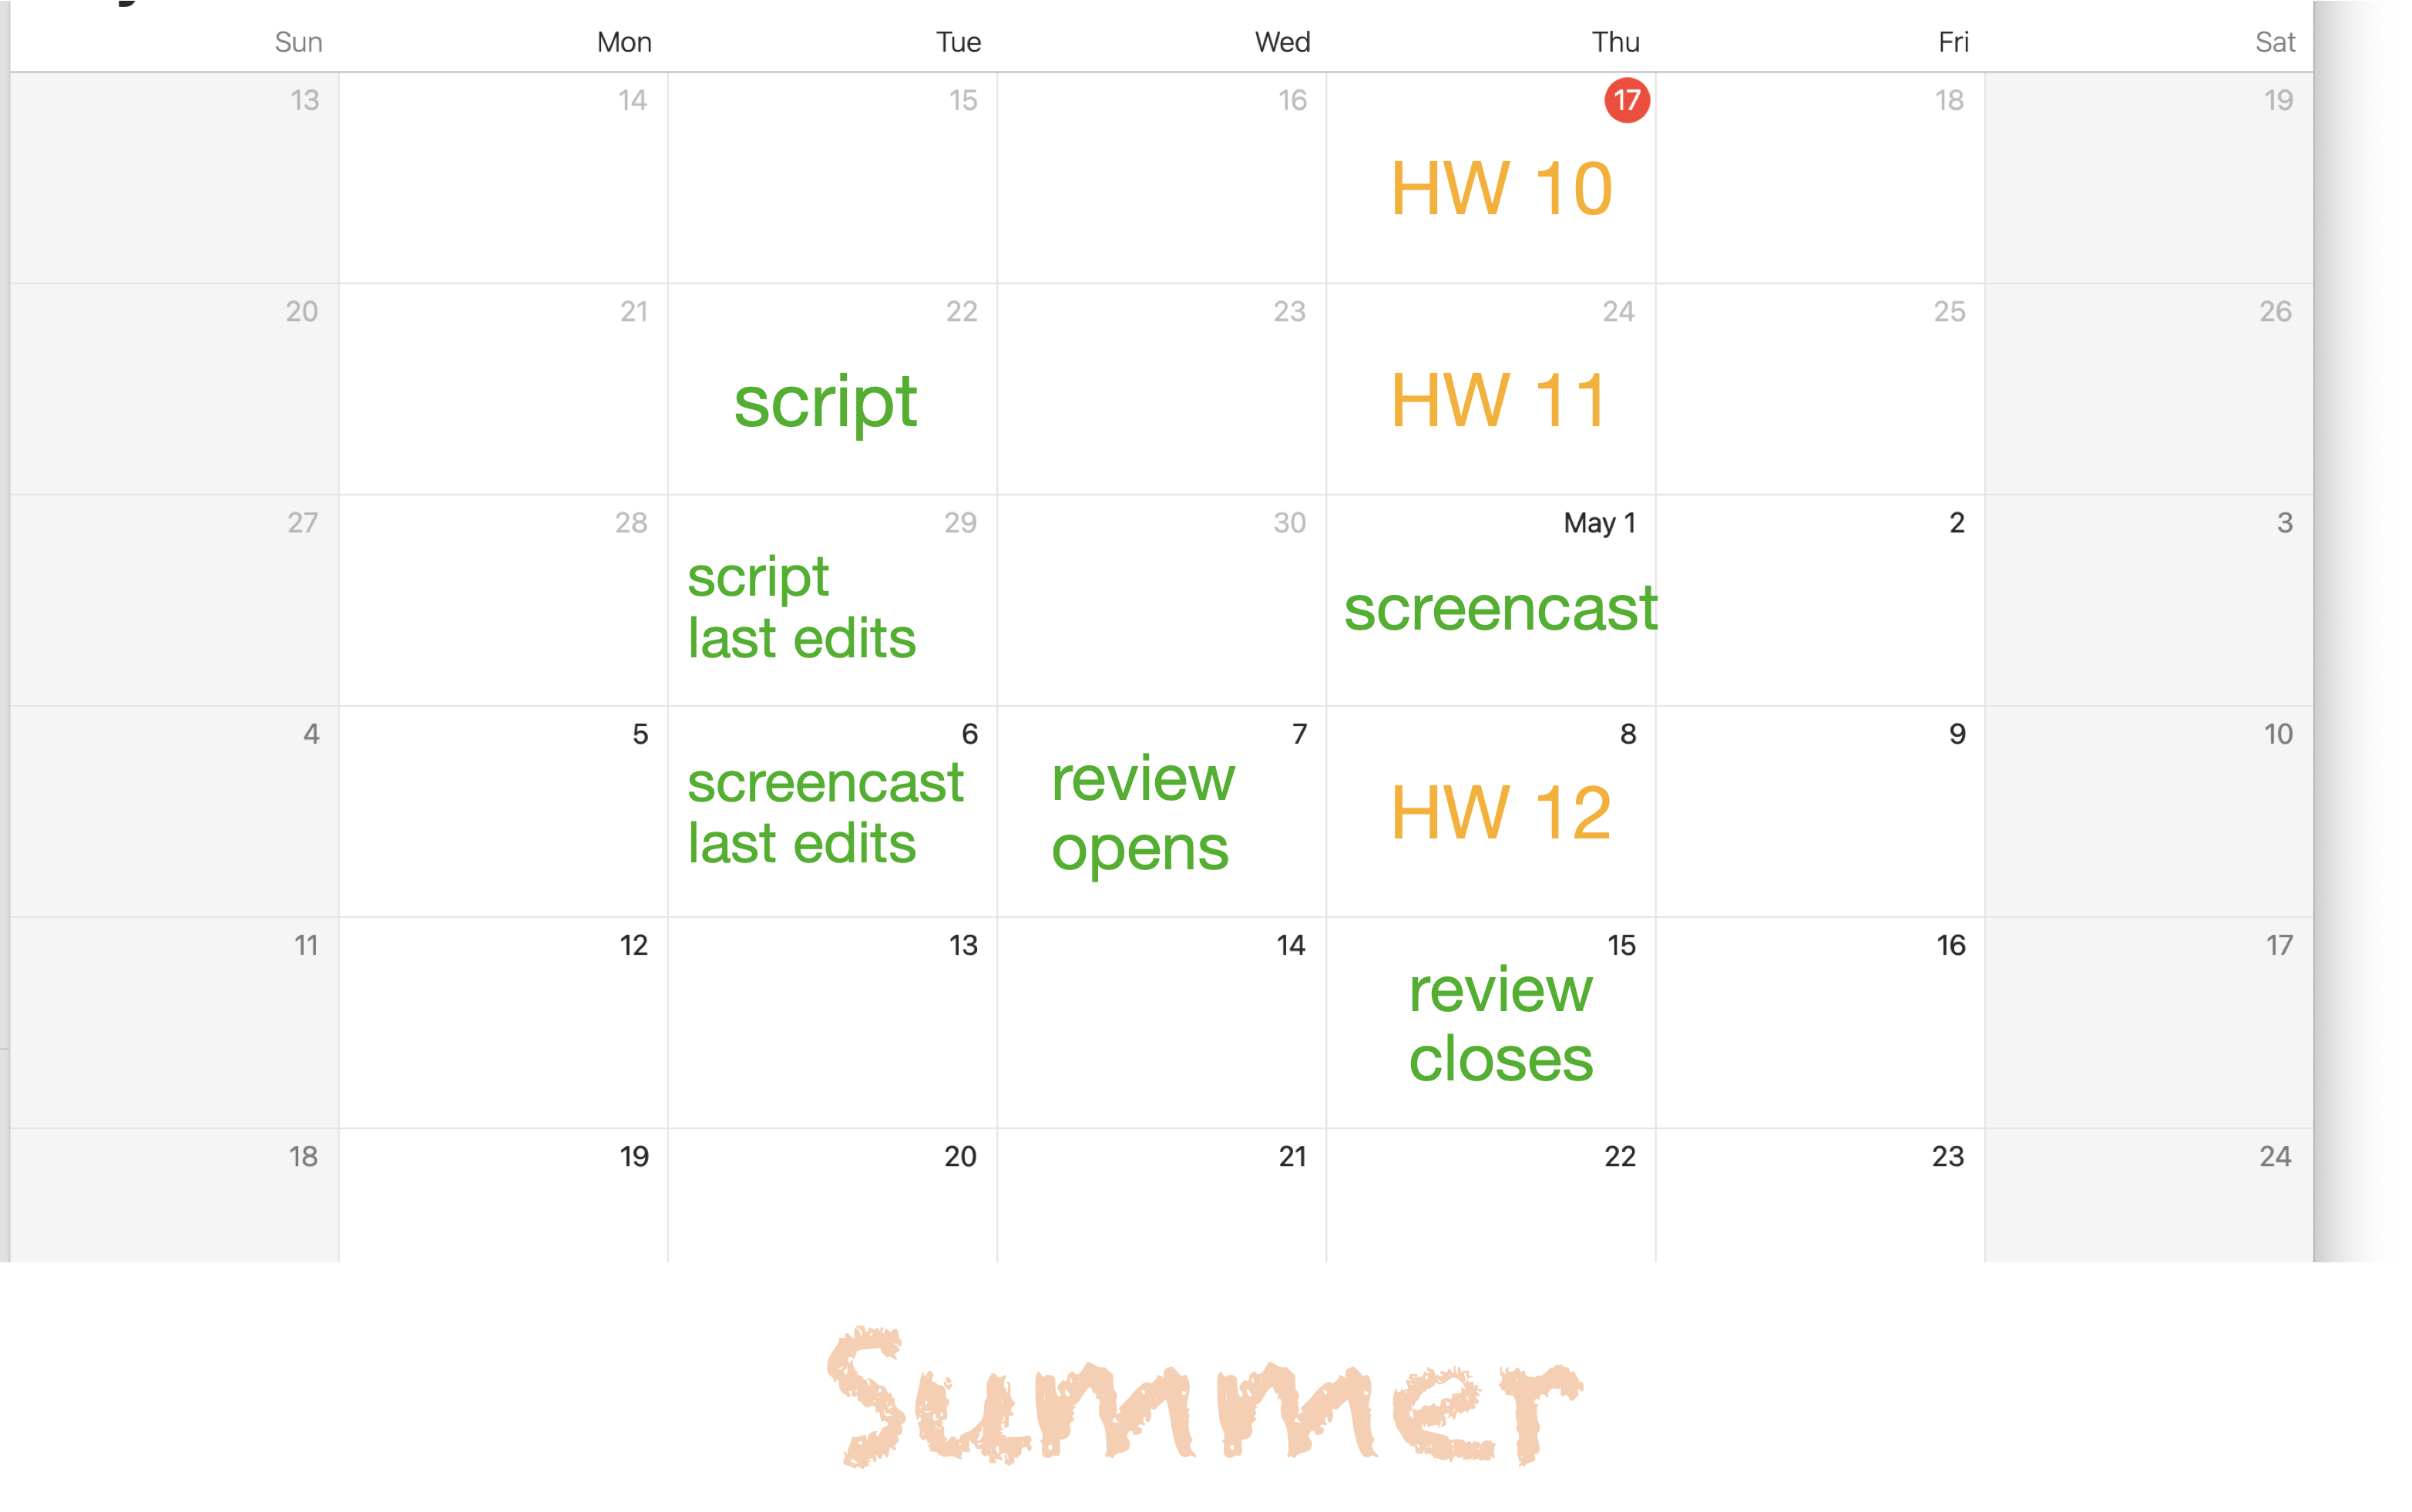
2025-05-06
Screencasts all look good
Make sure to fill out the class survey!
Peer Review is open:
Go into Canvas
Follow the link to the youtube video
Follow the link to the repo - you most likely don’t have access to the repo
portfolios are important for getting internships/industry positions
right now:
best solution (right now): make a new repo (public or private), copy the necessary files, and link that to your portfolio
Last homework assignment - essentially attendance-based
Work on some map-related question, submit by the end of class on Thursday for full credit
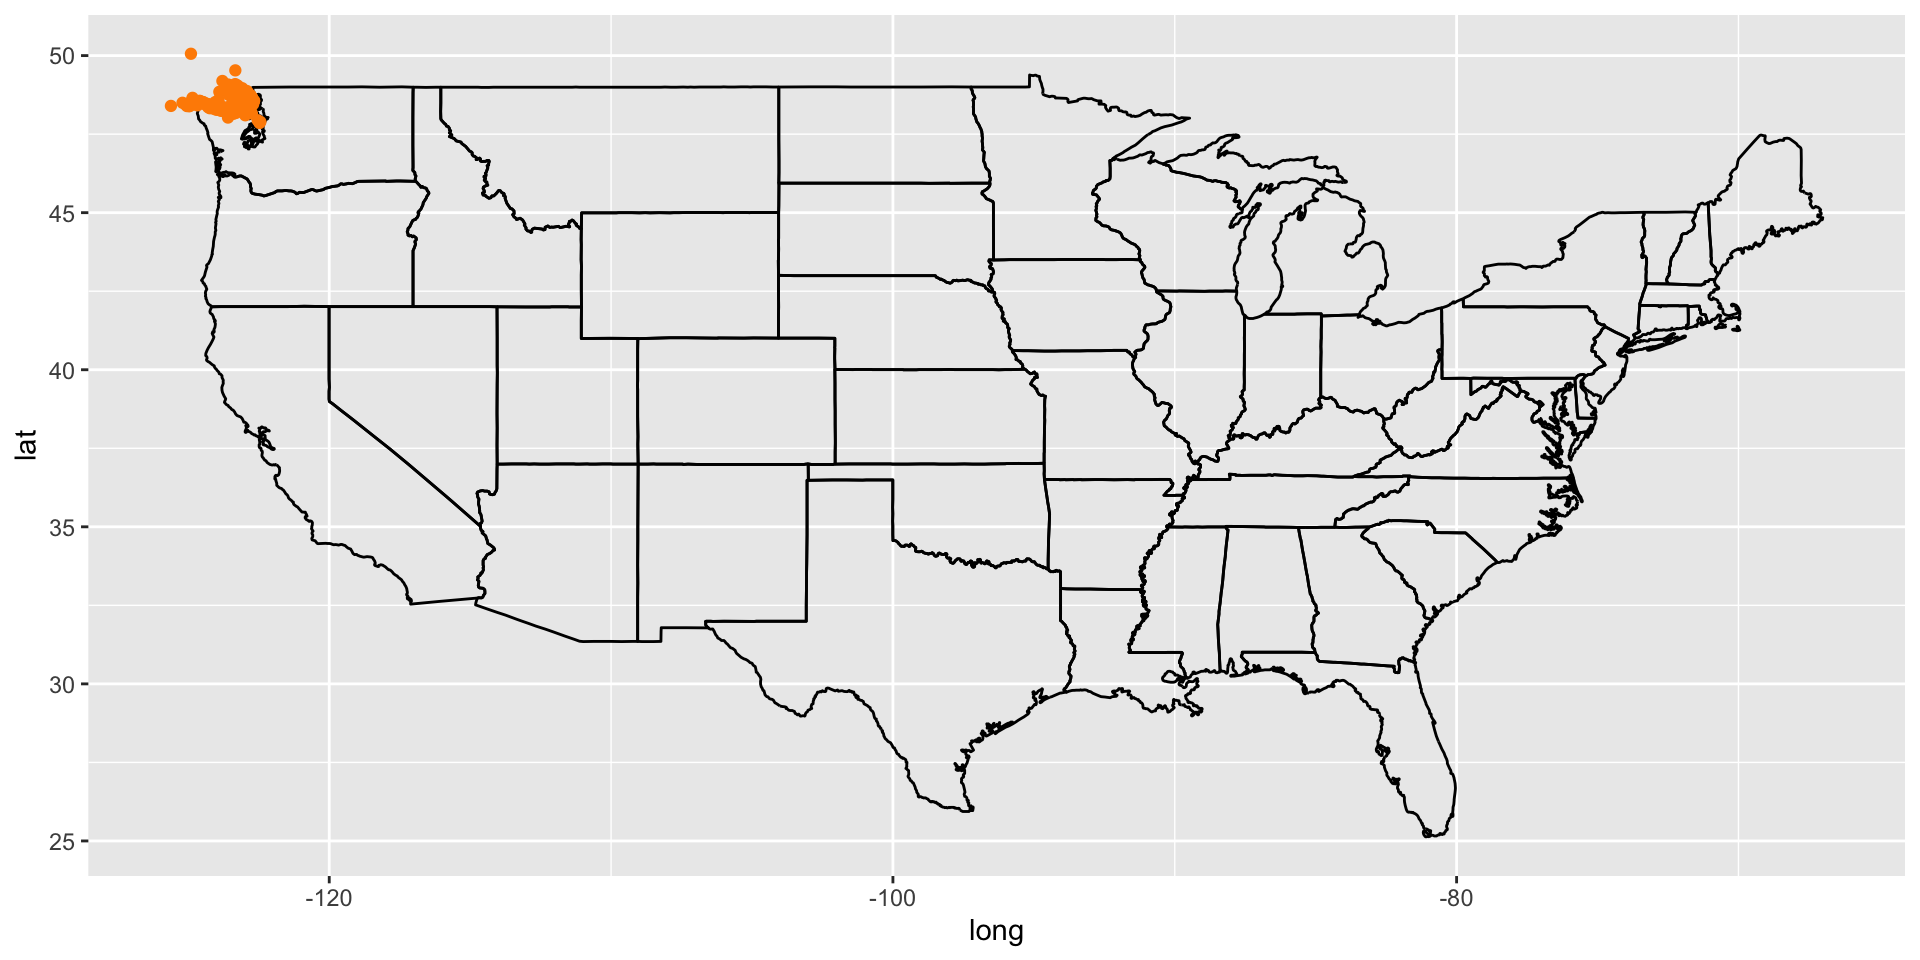
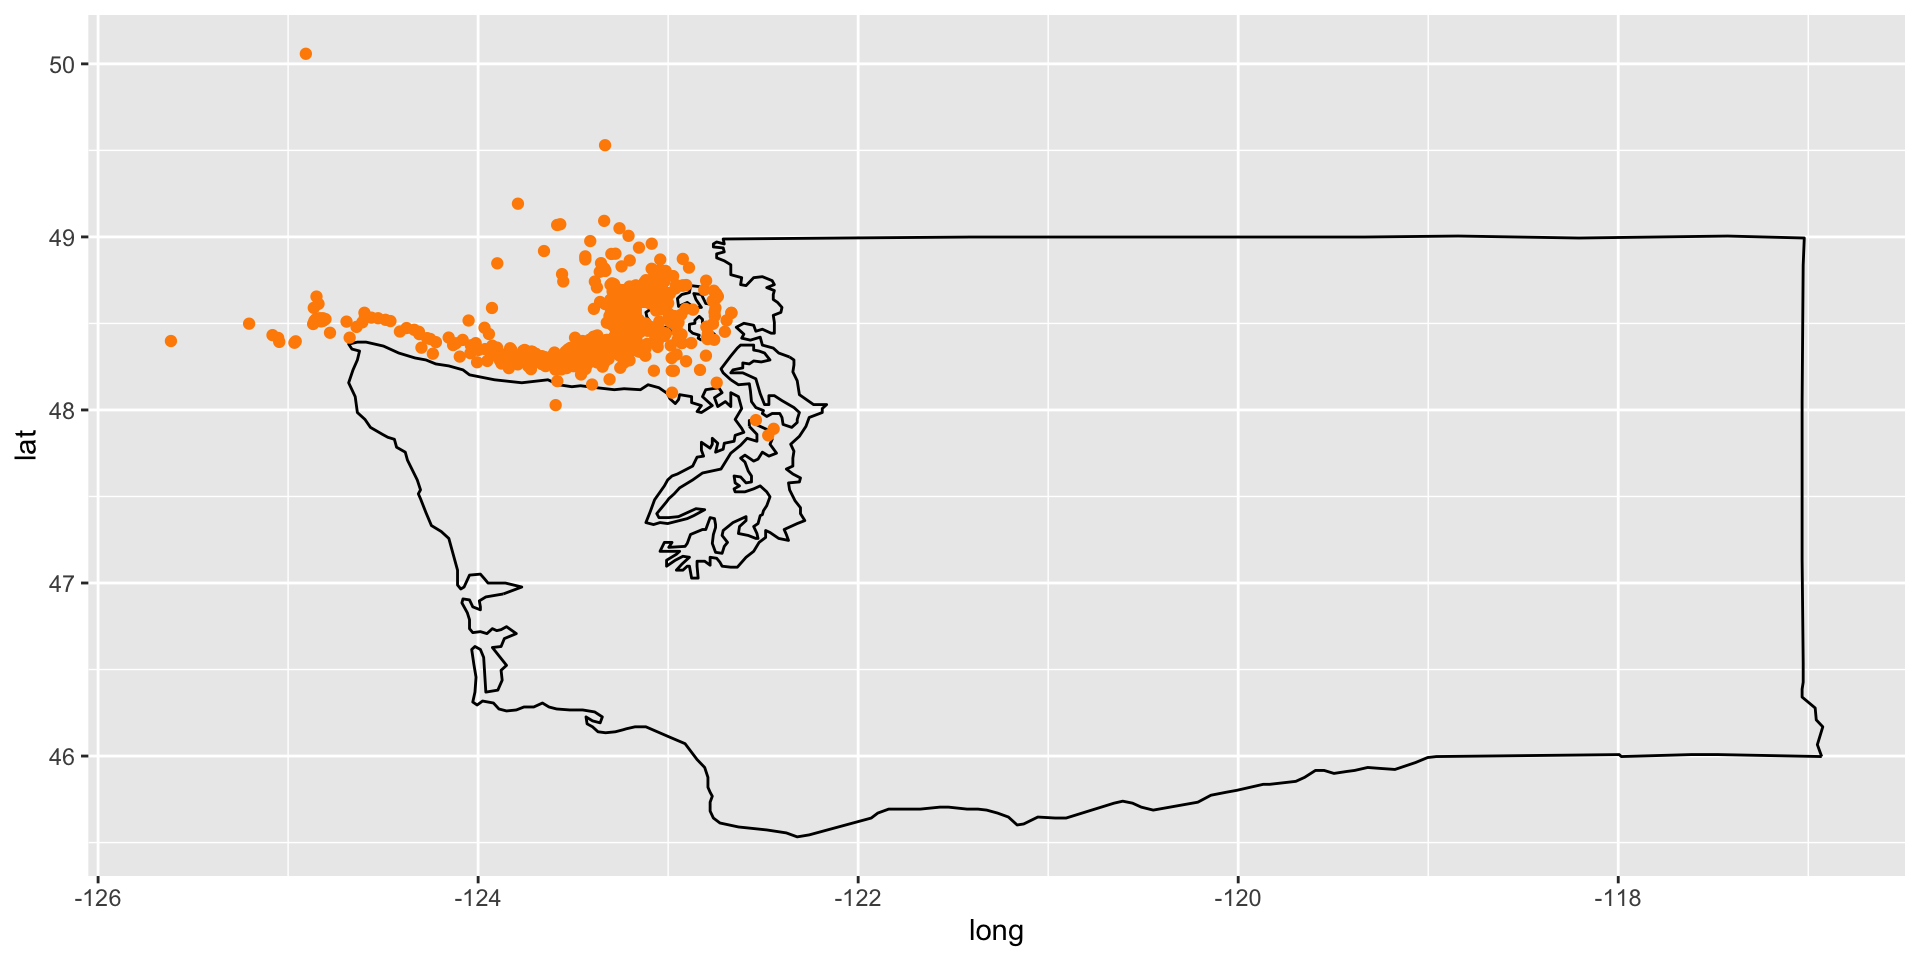
Maps provide a lot of context
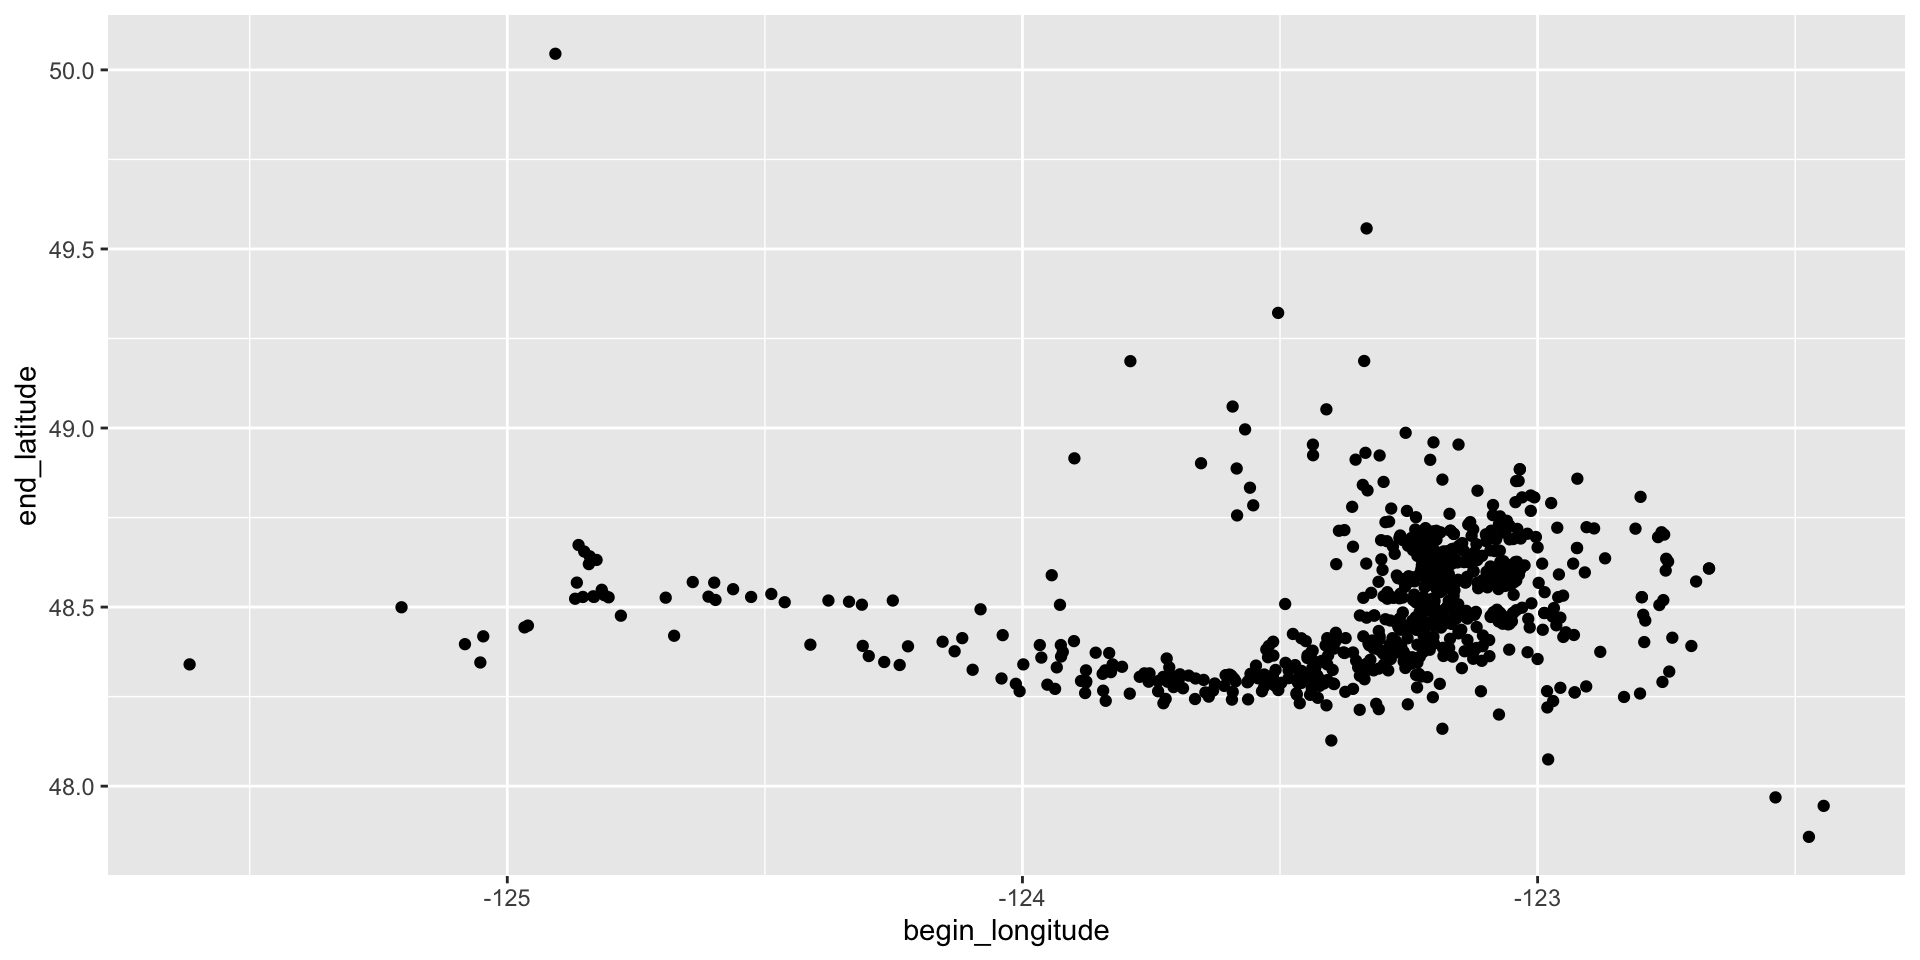
tuesdata <- tidytuesdayR::tt_load(2024, week = 42)

orcas <- tuesdata$orcas
usmap <- map_data("state")
usmap |>
  ggplot(aes(x = long, y = lat)) +
  geom_path(aes(group = group)) +
  geom_point(data = orcas, aes(x = begin_longitude, y = begin_latitude), colour = "darkorange")
usmap |> dplyr::filter(region=="washington") |>
  ggplot(aes(x = long, y = lat)) +
  geom_path(aes(group = group)) +
  geom_point(data = orcas, aes(x = begin_longitude, y = begin_latitude), colour = "darkorange")