Tables and Charts
Fixing the Reading…
Colorblind friendly is important
Dual encoding (shape/linetype + color) helps a lot
Grid lines are a good thing (you’re wrong, SWHR!)
3D graphs only work if you 3d print them
Ok, I don’t have proof of this yet, but I’m working on it…Figure titles - above, below
conform to the style guide you’re usingDon’t make graphs in MS Word or Excel. Just… don’t.
Fig 8.1 ‘Histogram of ratings of all chess players rated by FIDE in December 2020’
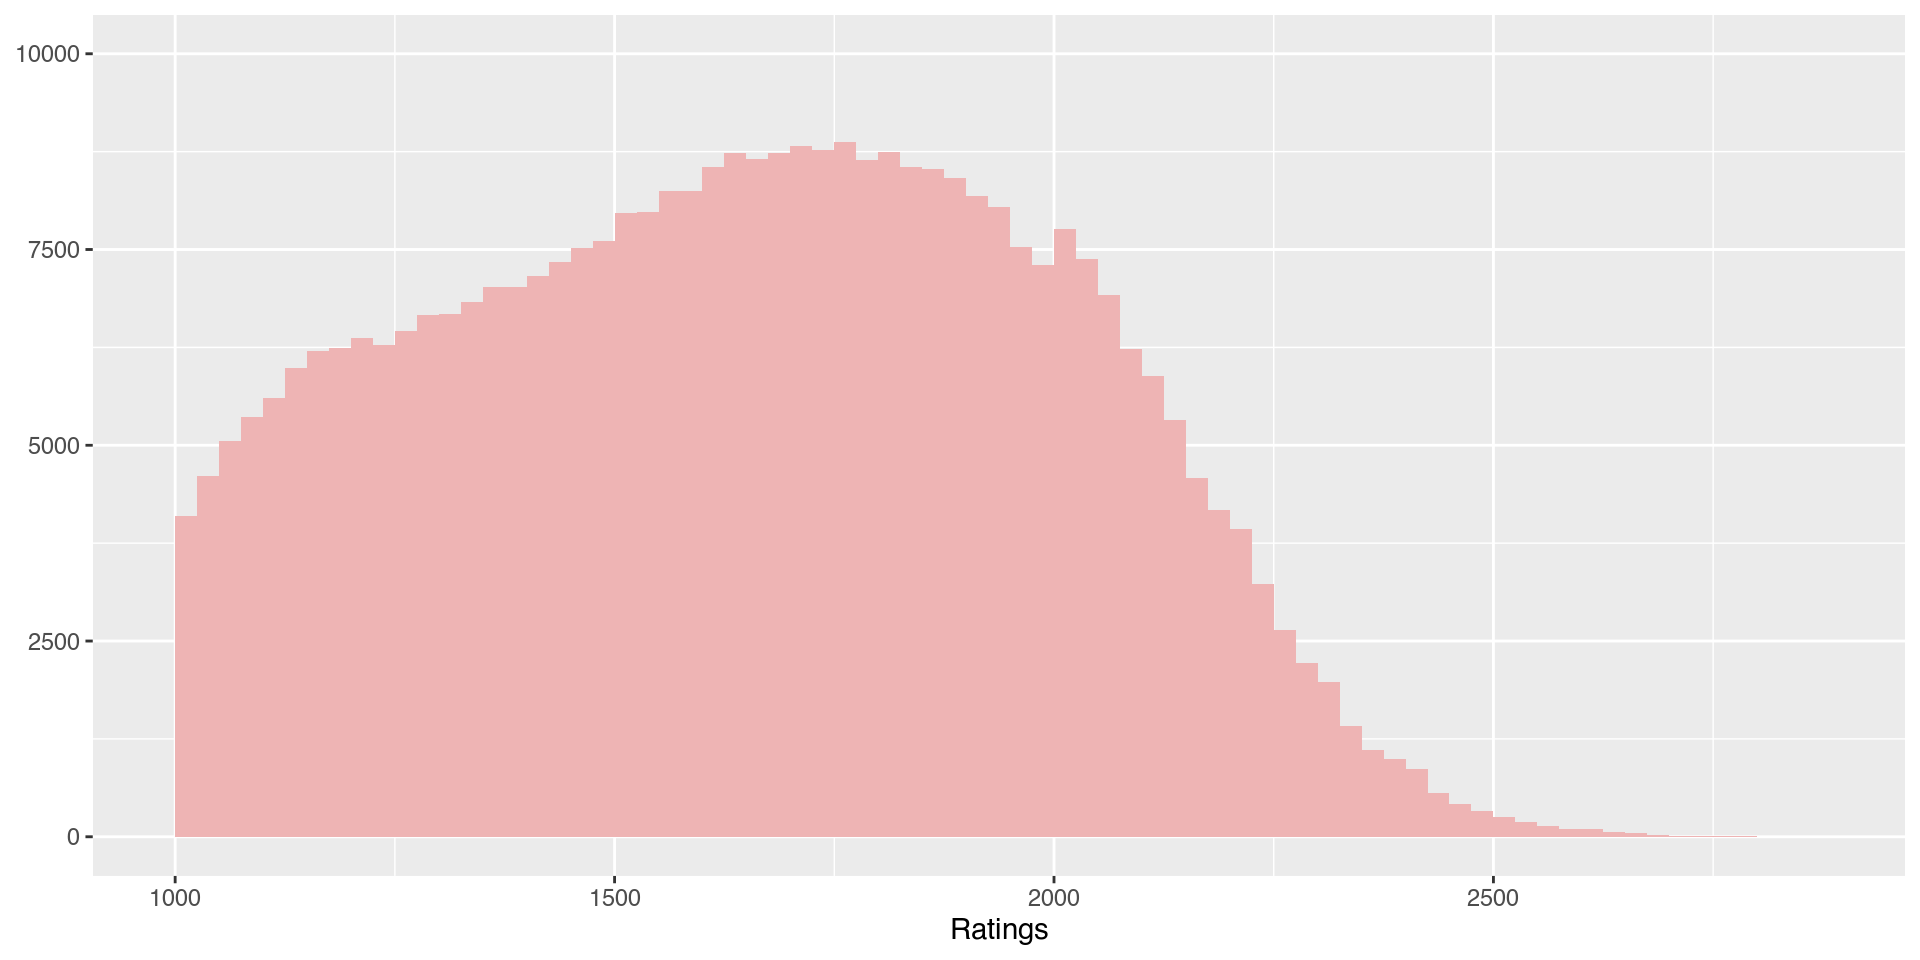
Fig 8.2 ‘Boxplot of ratings of all FIDE rated chess players in December 2020’
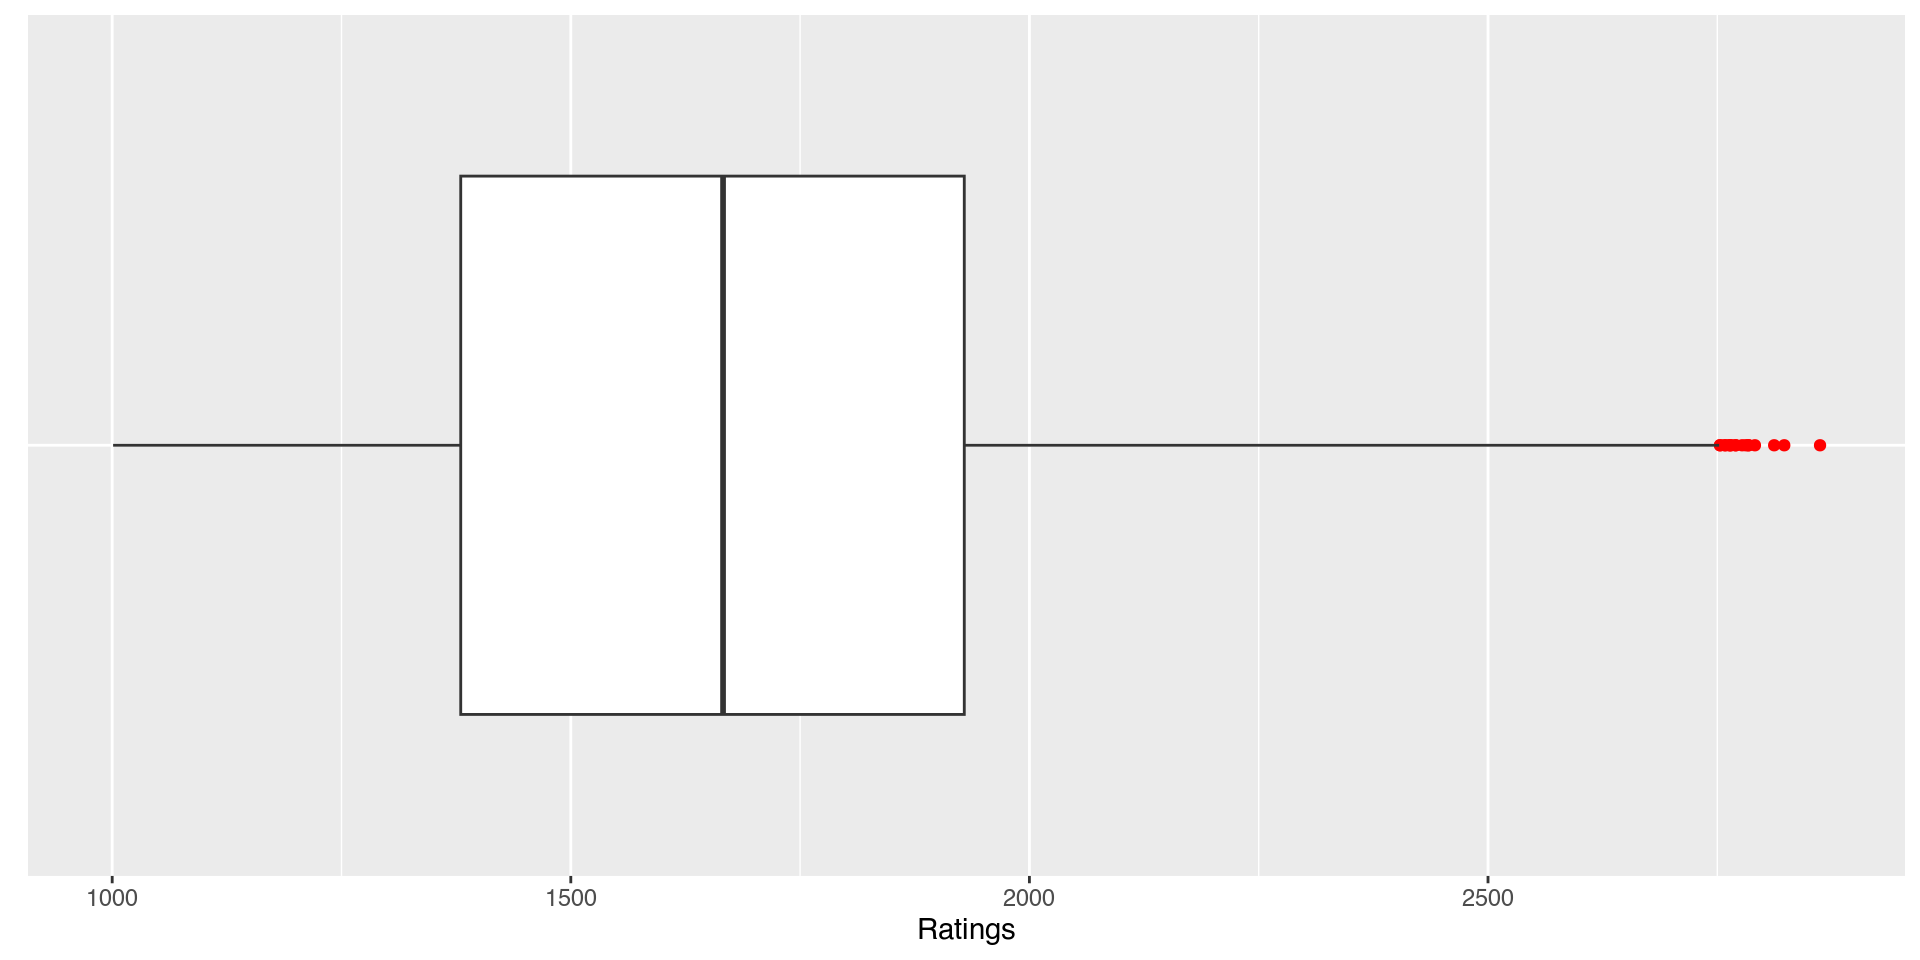
Fig 8.3 ‘Histograms of ratings for active and inactive players’
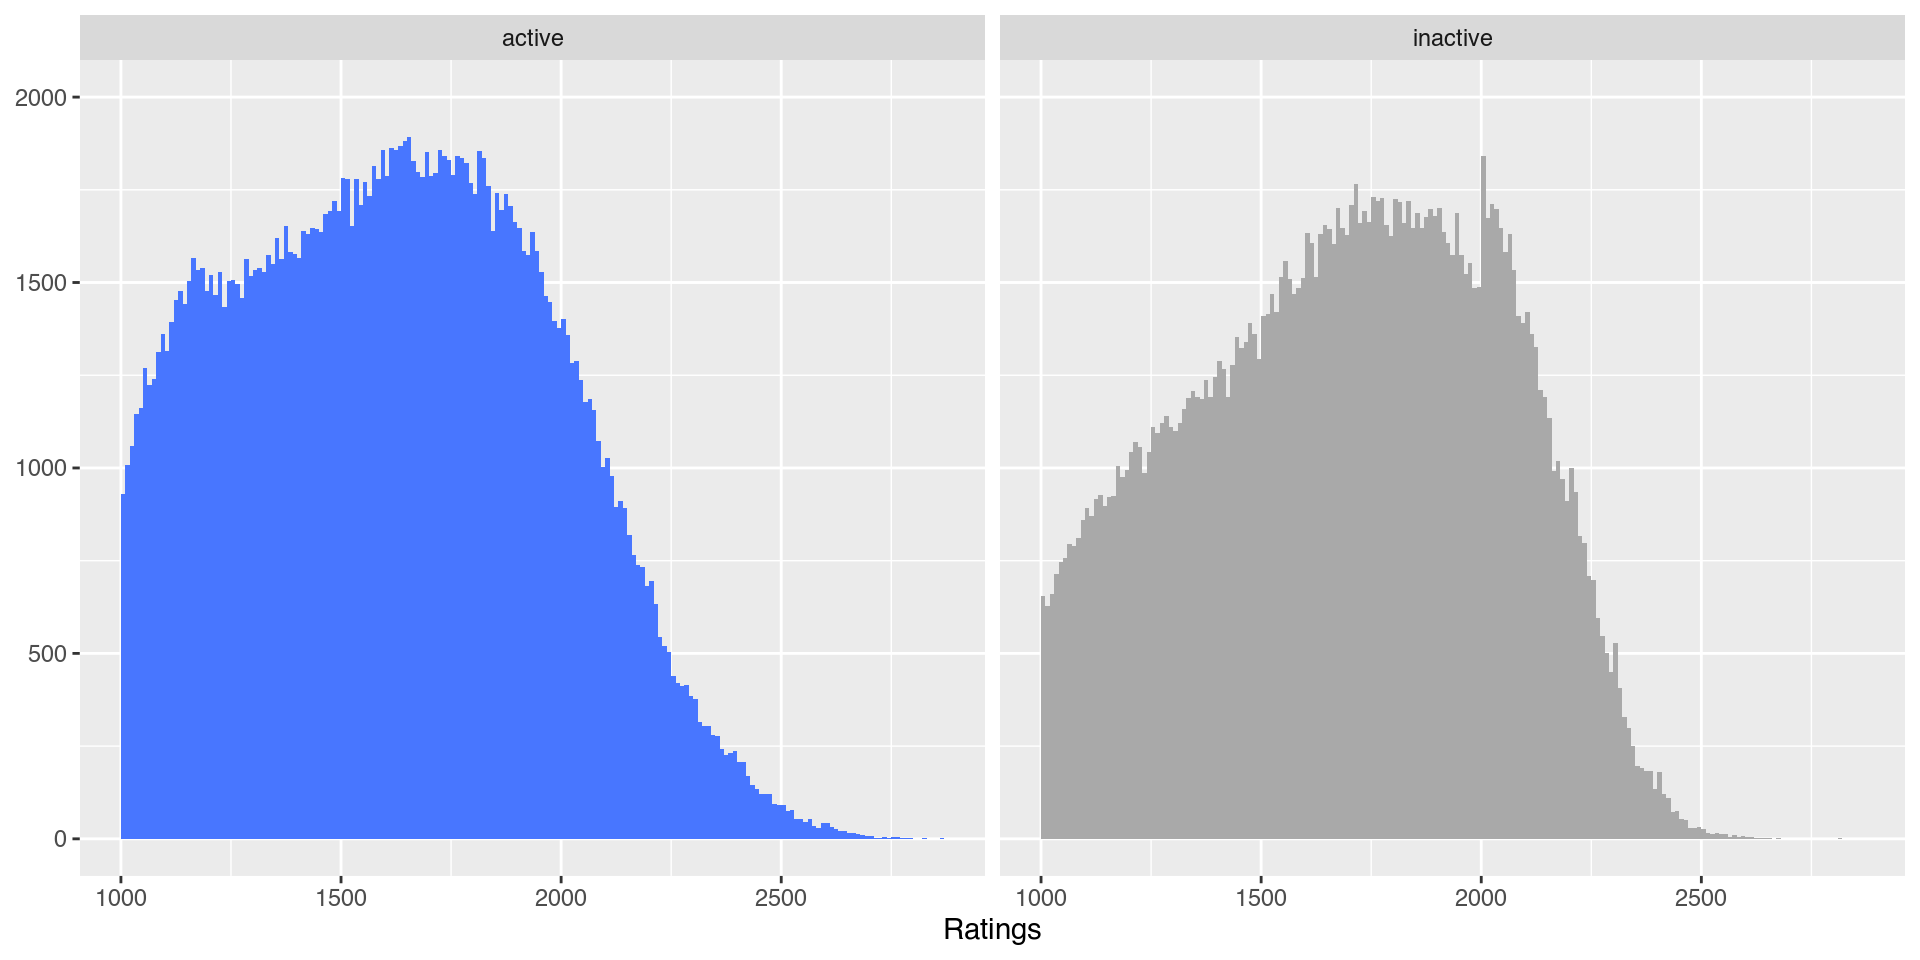
Fig 8.4 ‘Density estimates of distributions of ratings for active and inactive players’
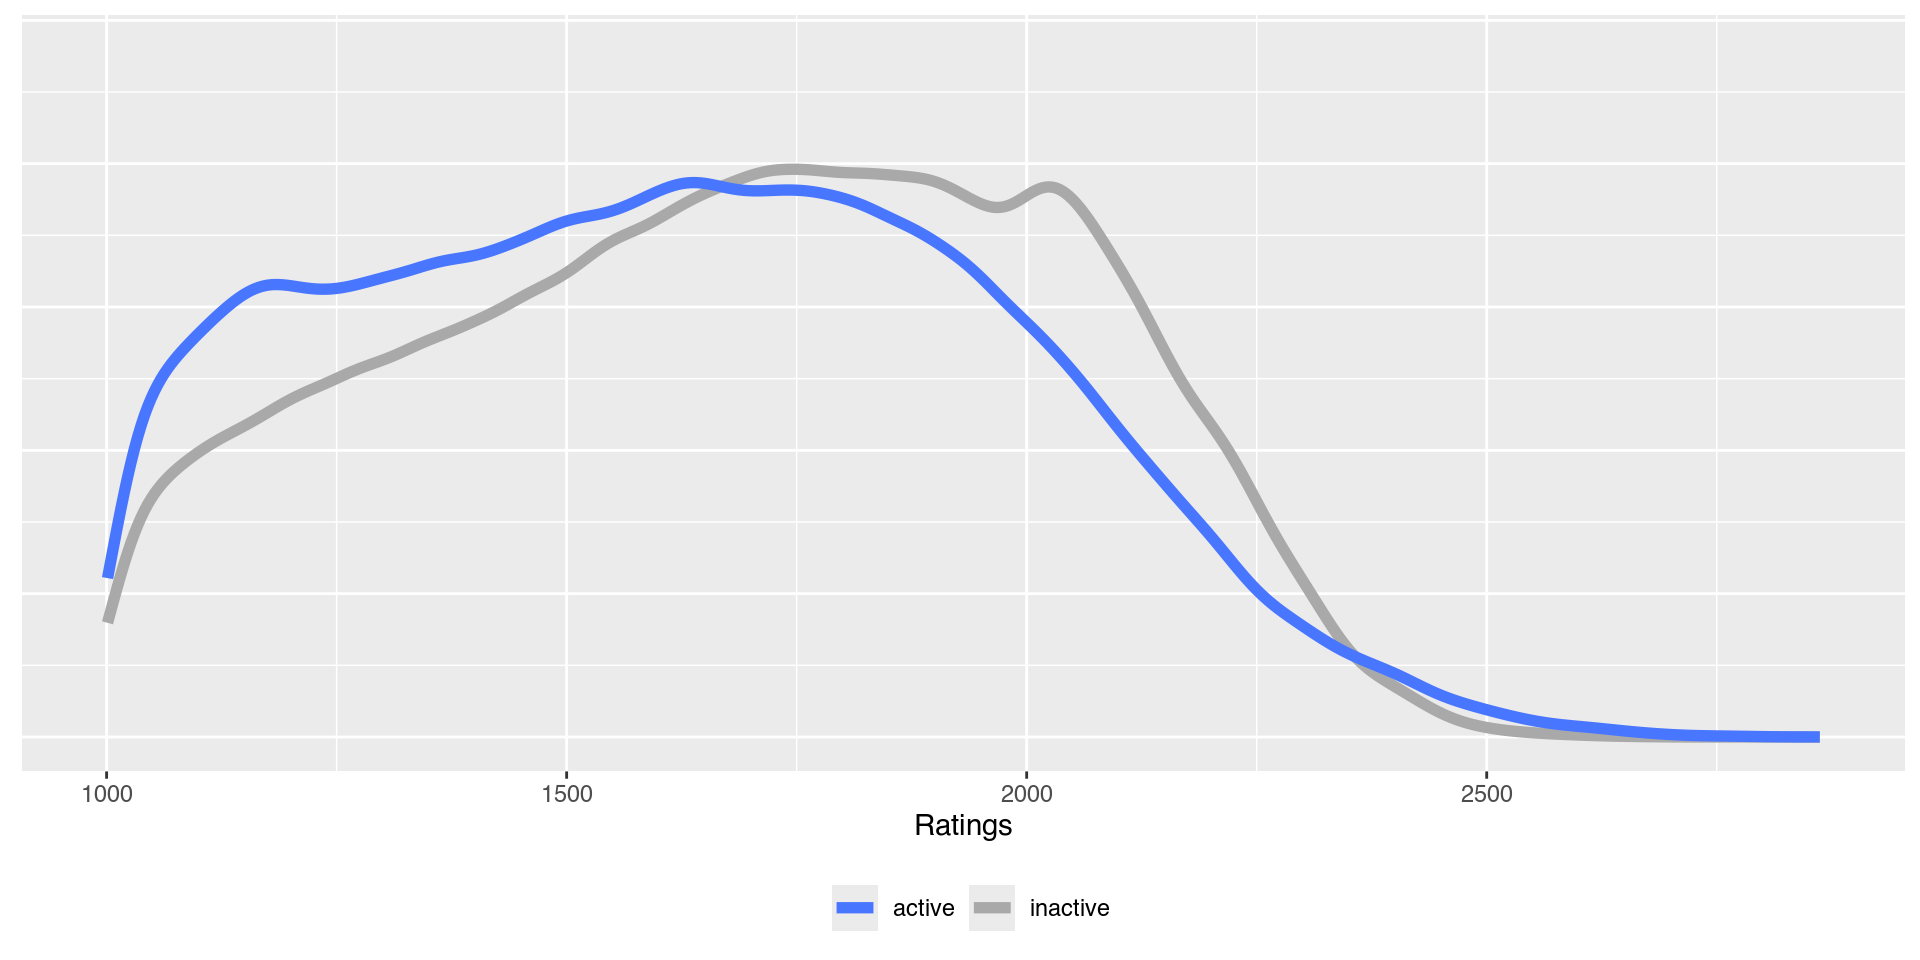
Fig 8.5 ‘Density estimates of age distributions for active and inactive players’
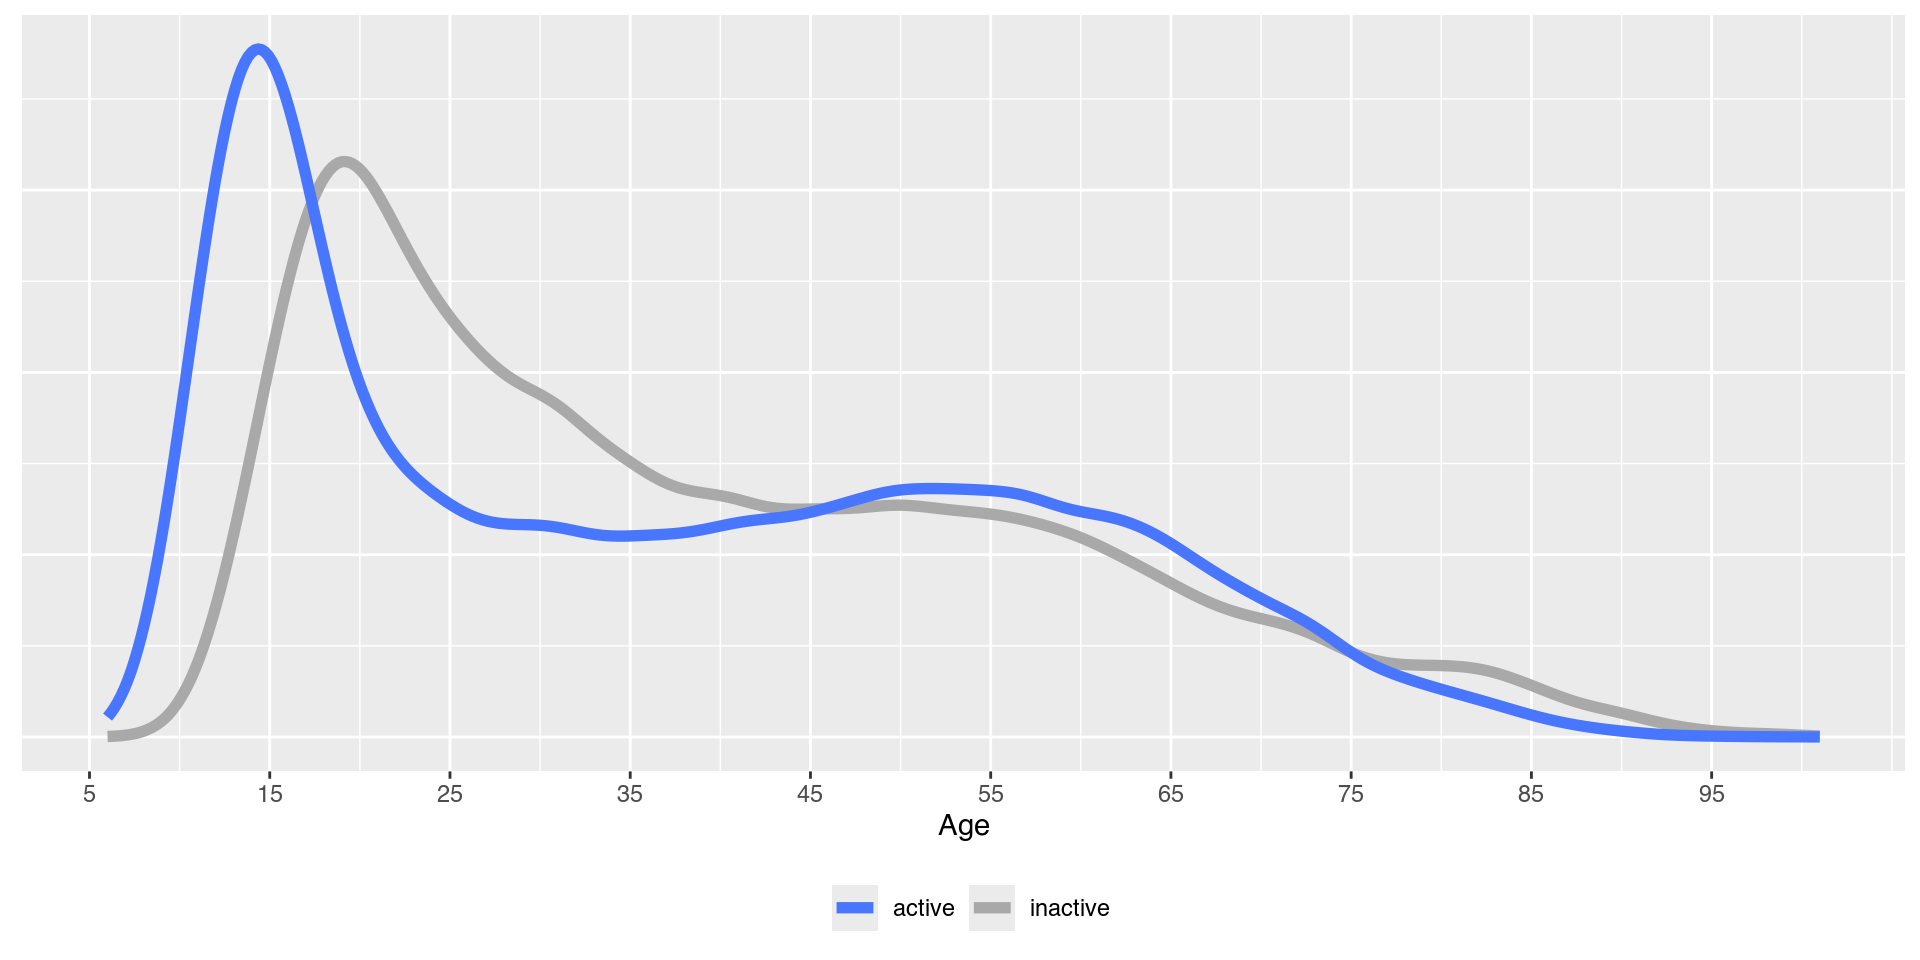
Fig 8.6 ’Boxplots of ratings for active players by sex
boxplot widths are proportional to the square roots of the sizes of the groups and outliers are drawn in red
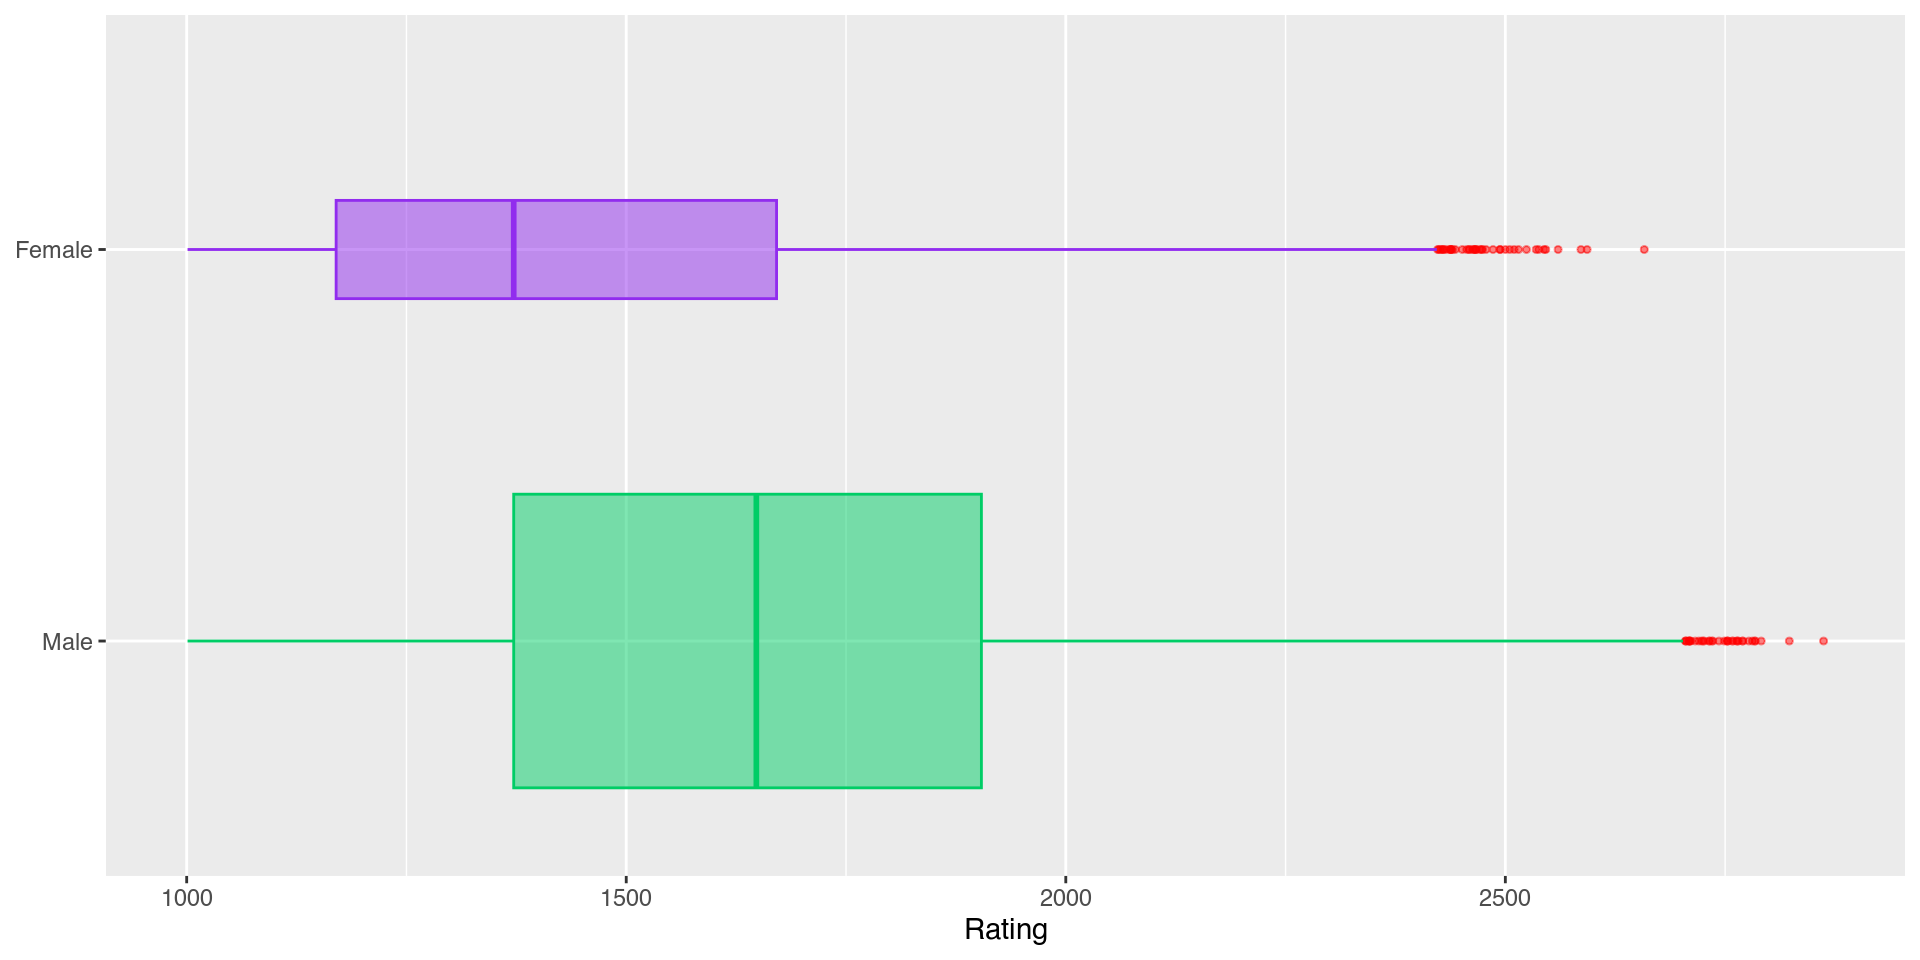
Fig 8.7 ’Ratings of the top 1000 male and top 1000 female players in December 2020
with line widths proportional to group sizes
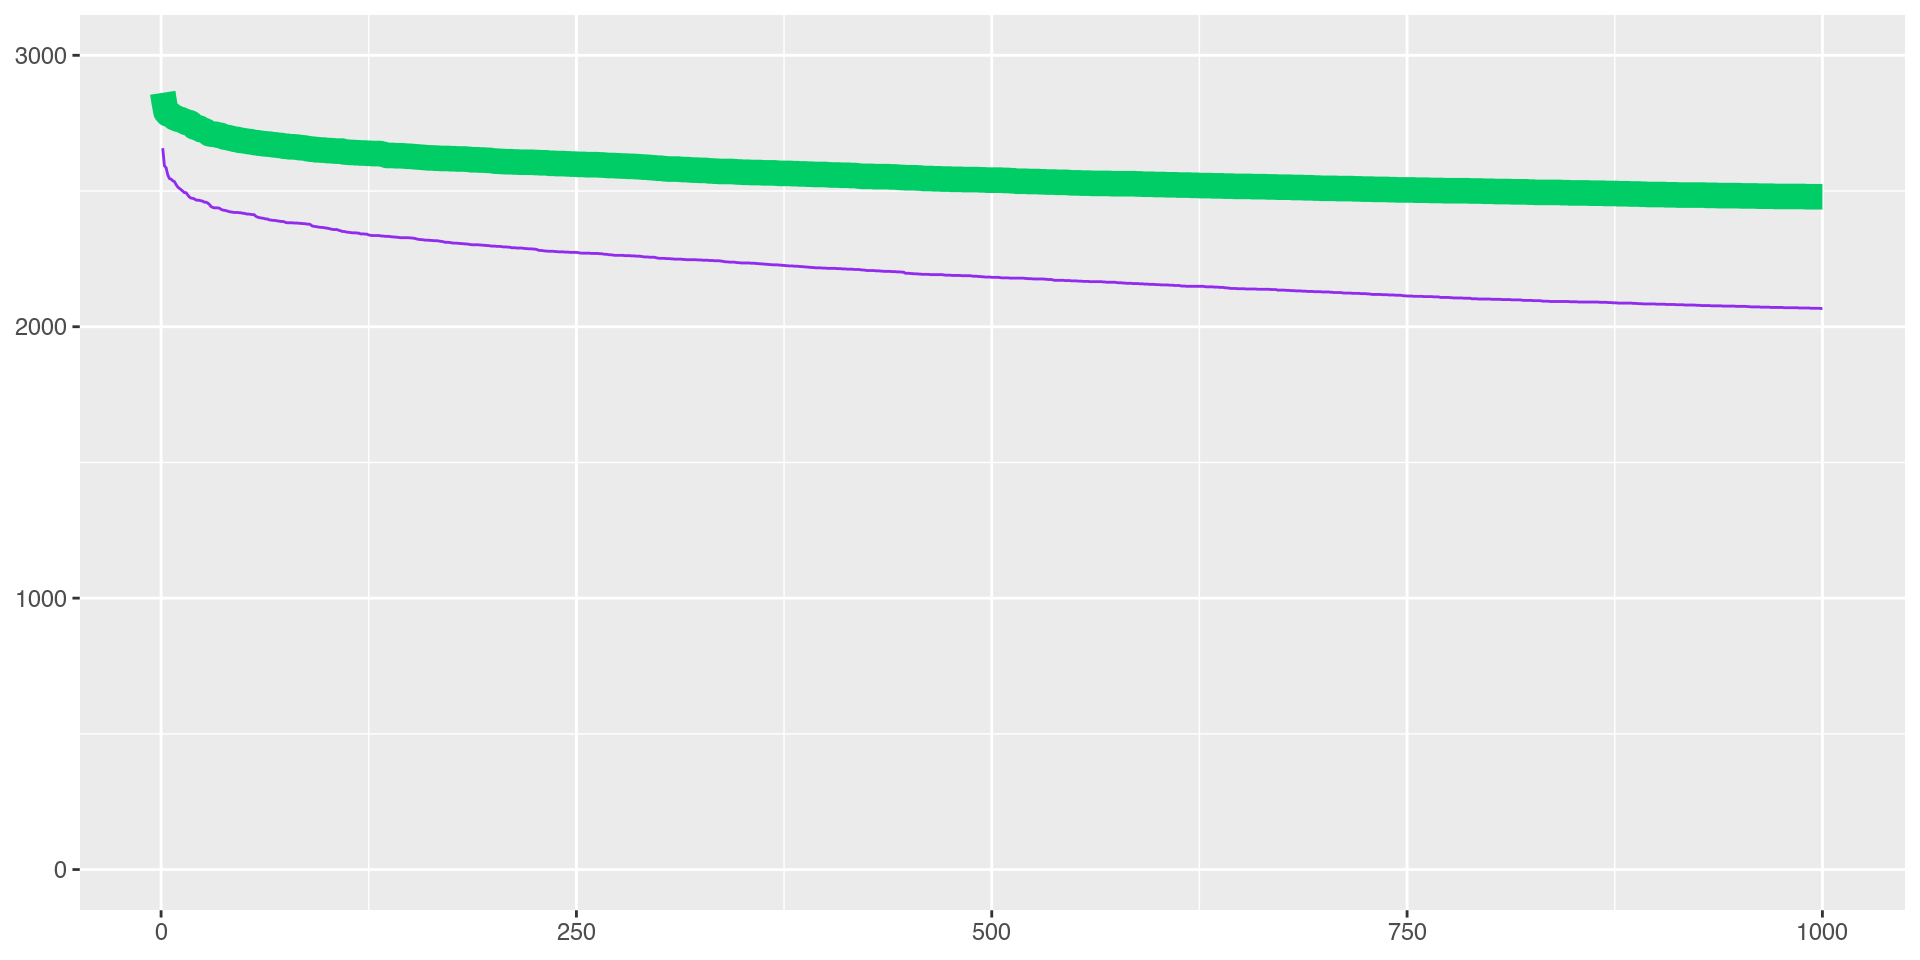
Fig 8.8 ‘Differences between the ratings of the top 1000 male and top 1000 female players in December 2020’
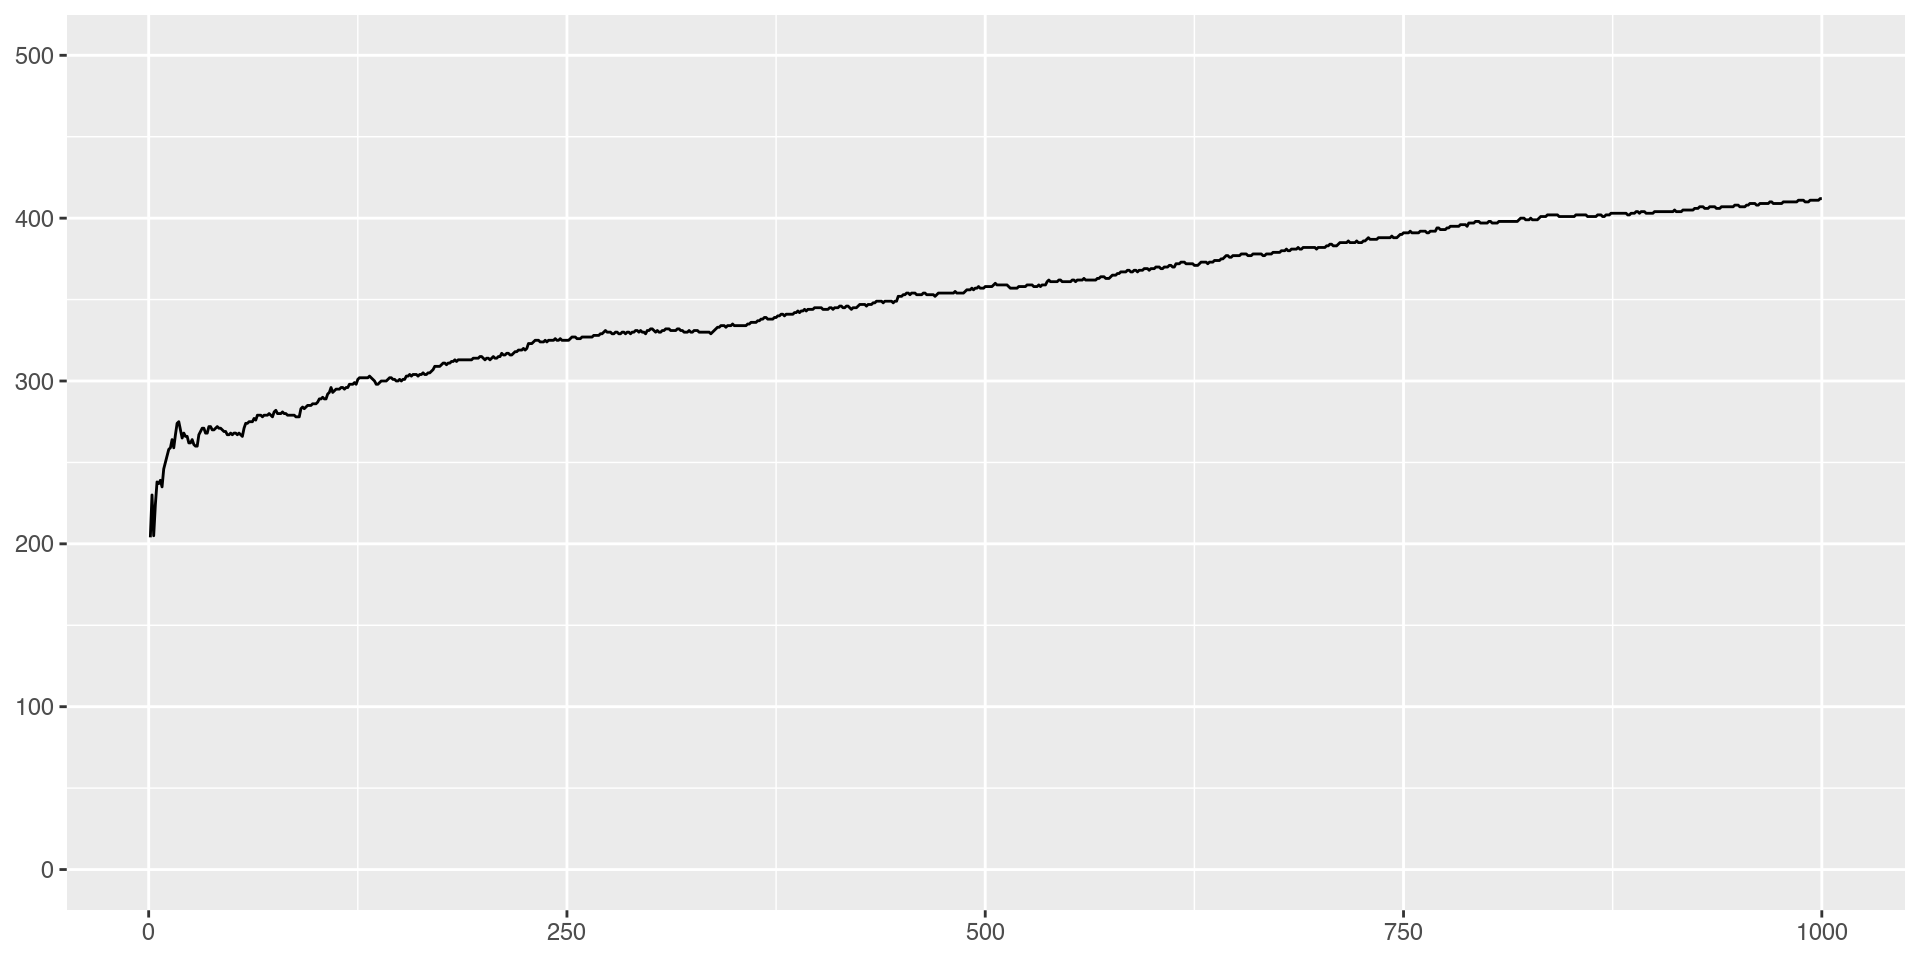
Fig 8.9 ‘Density estimates of age distributions of active players’
(females in purple, line widths proportional to group sizes)
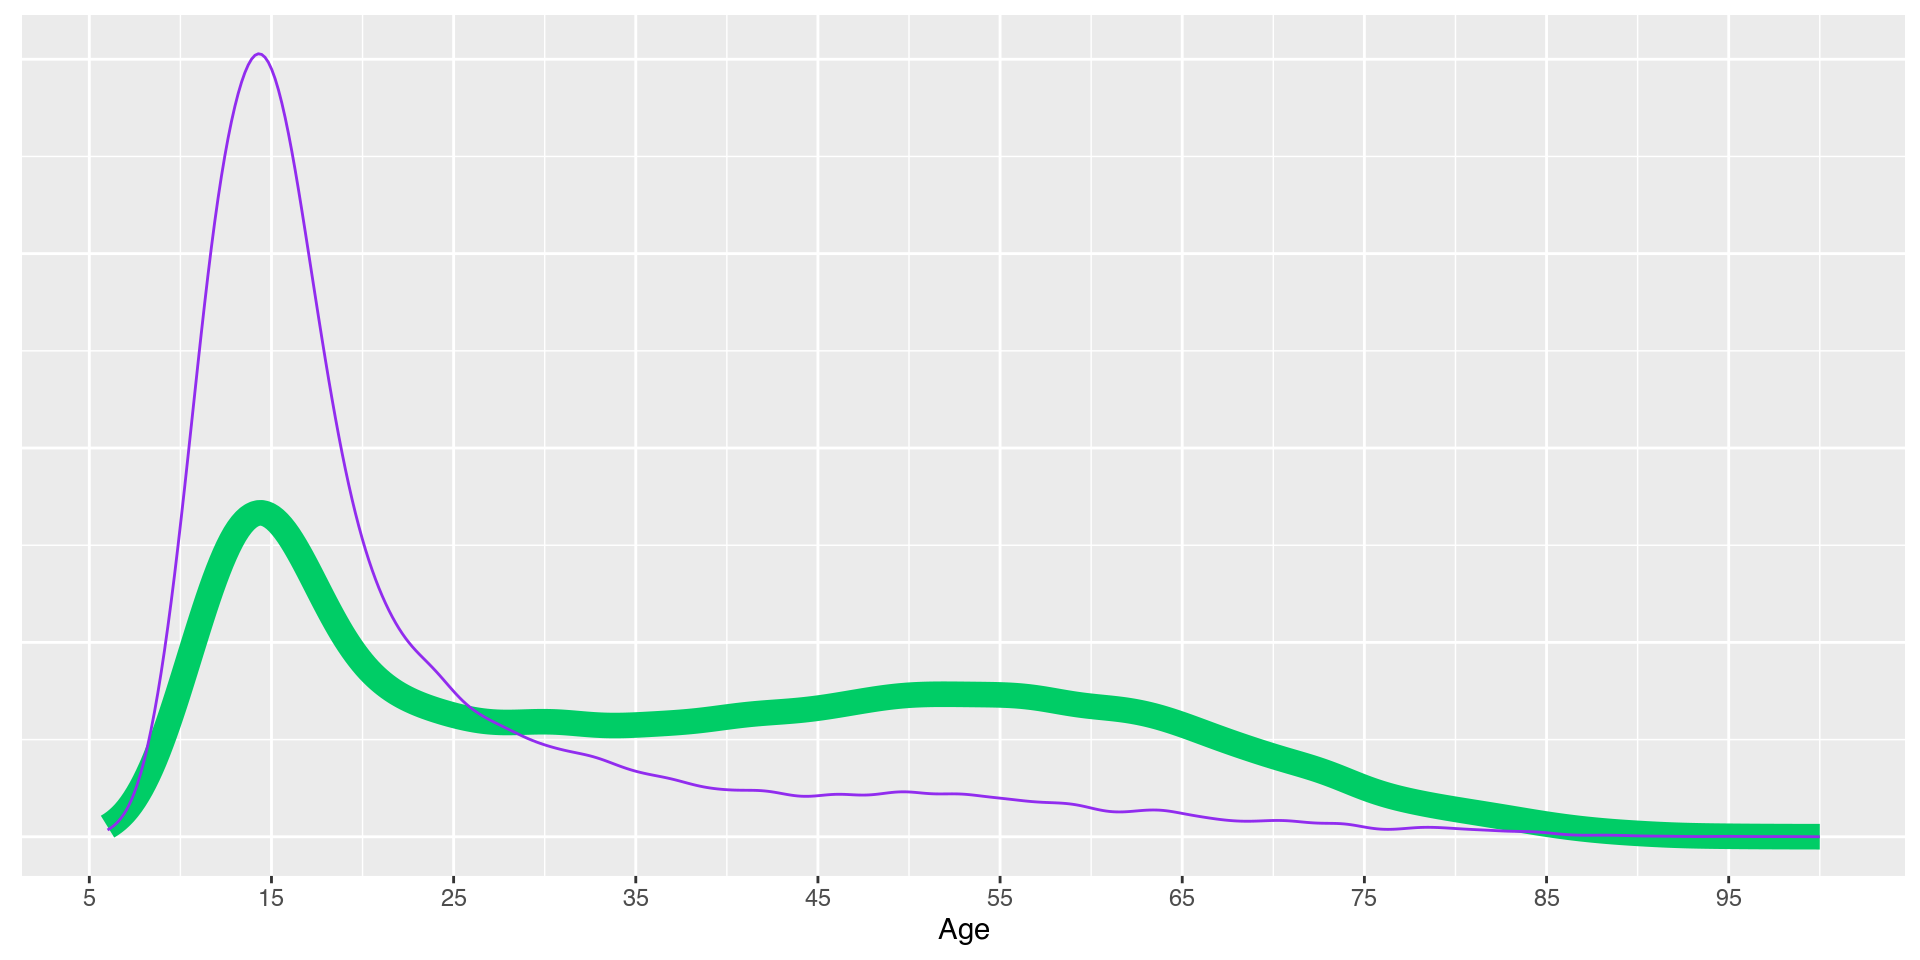
Fig 8.10 ‘Age distributions of active players’
(females in purple)
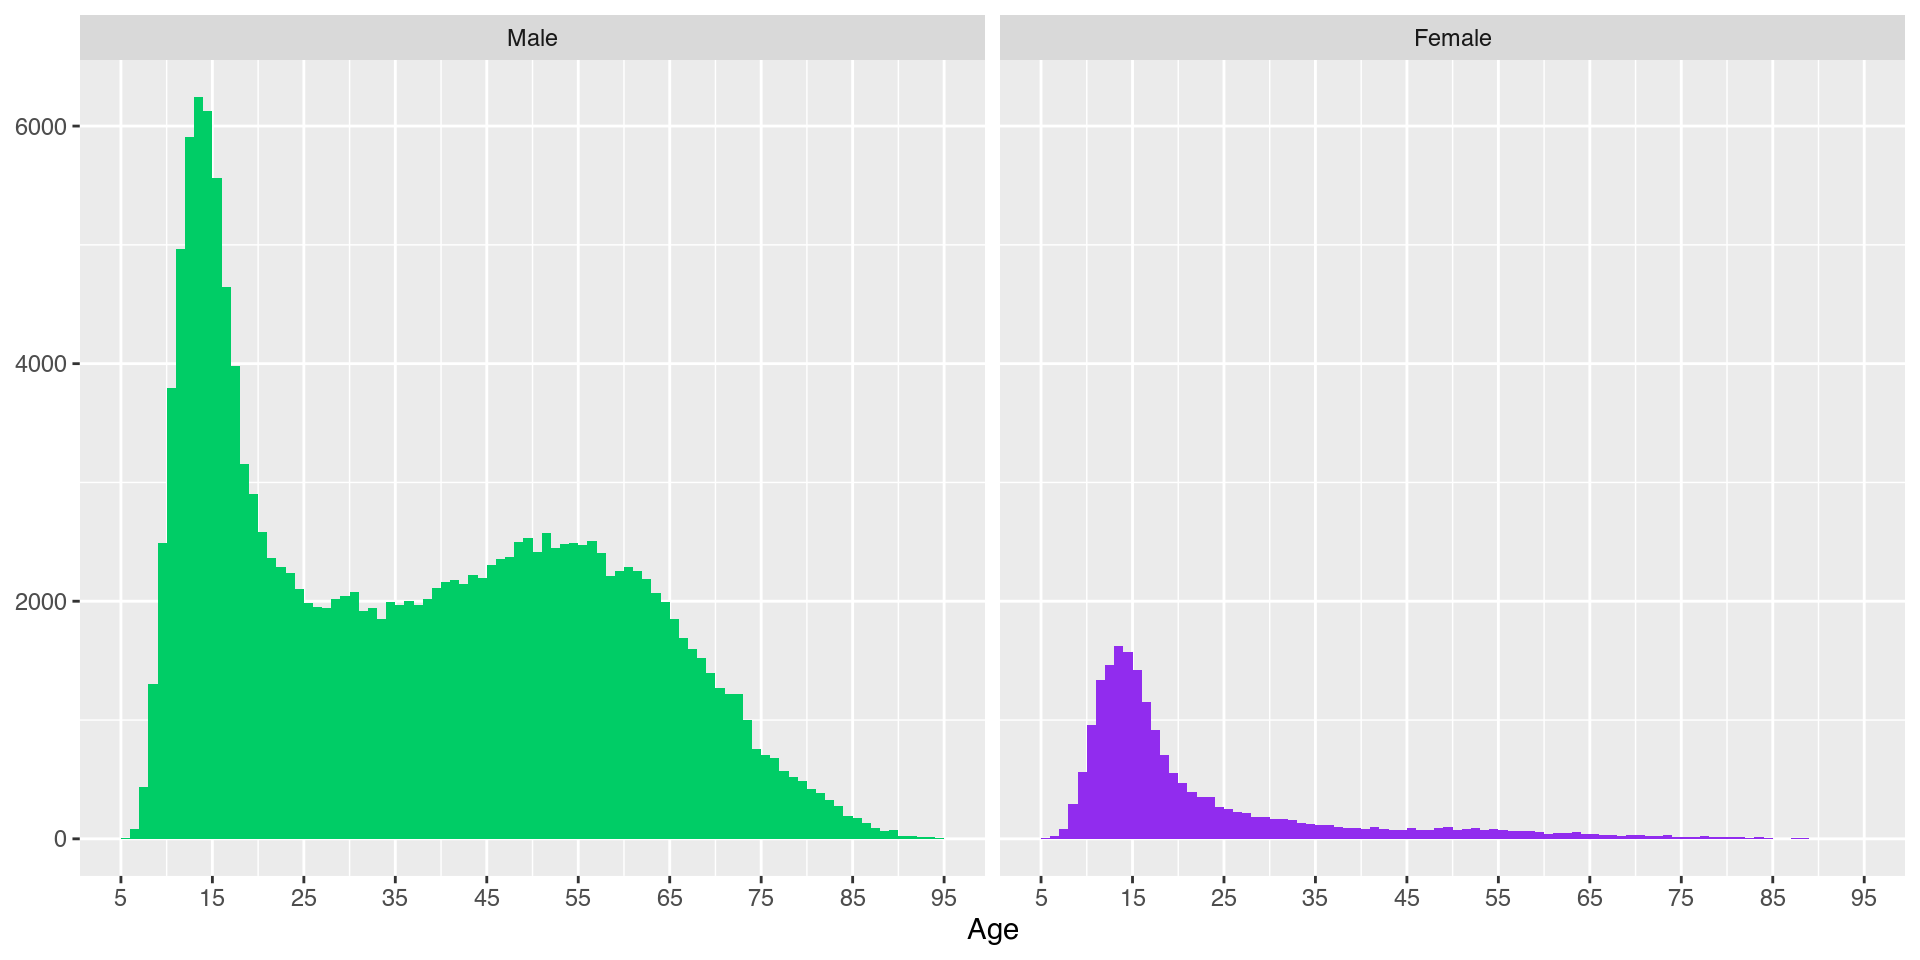
Fig 8.11 ‘Numbers of active rated players by country’
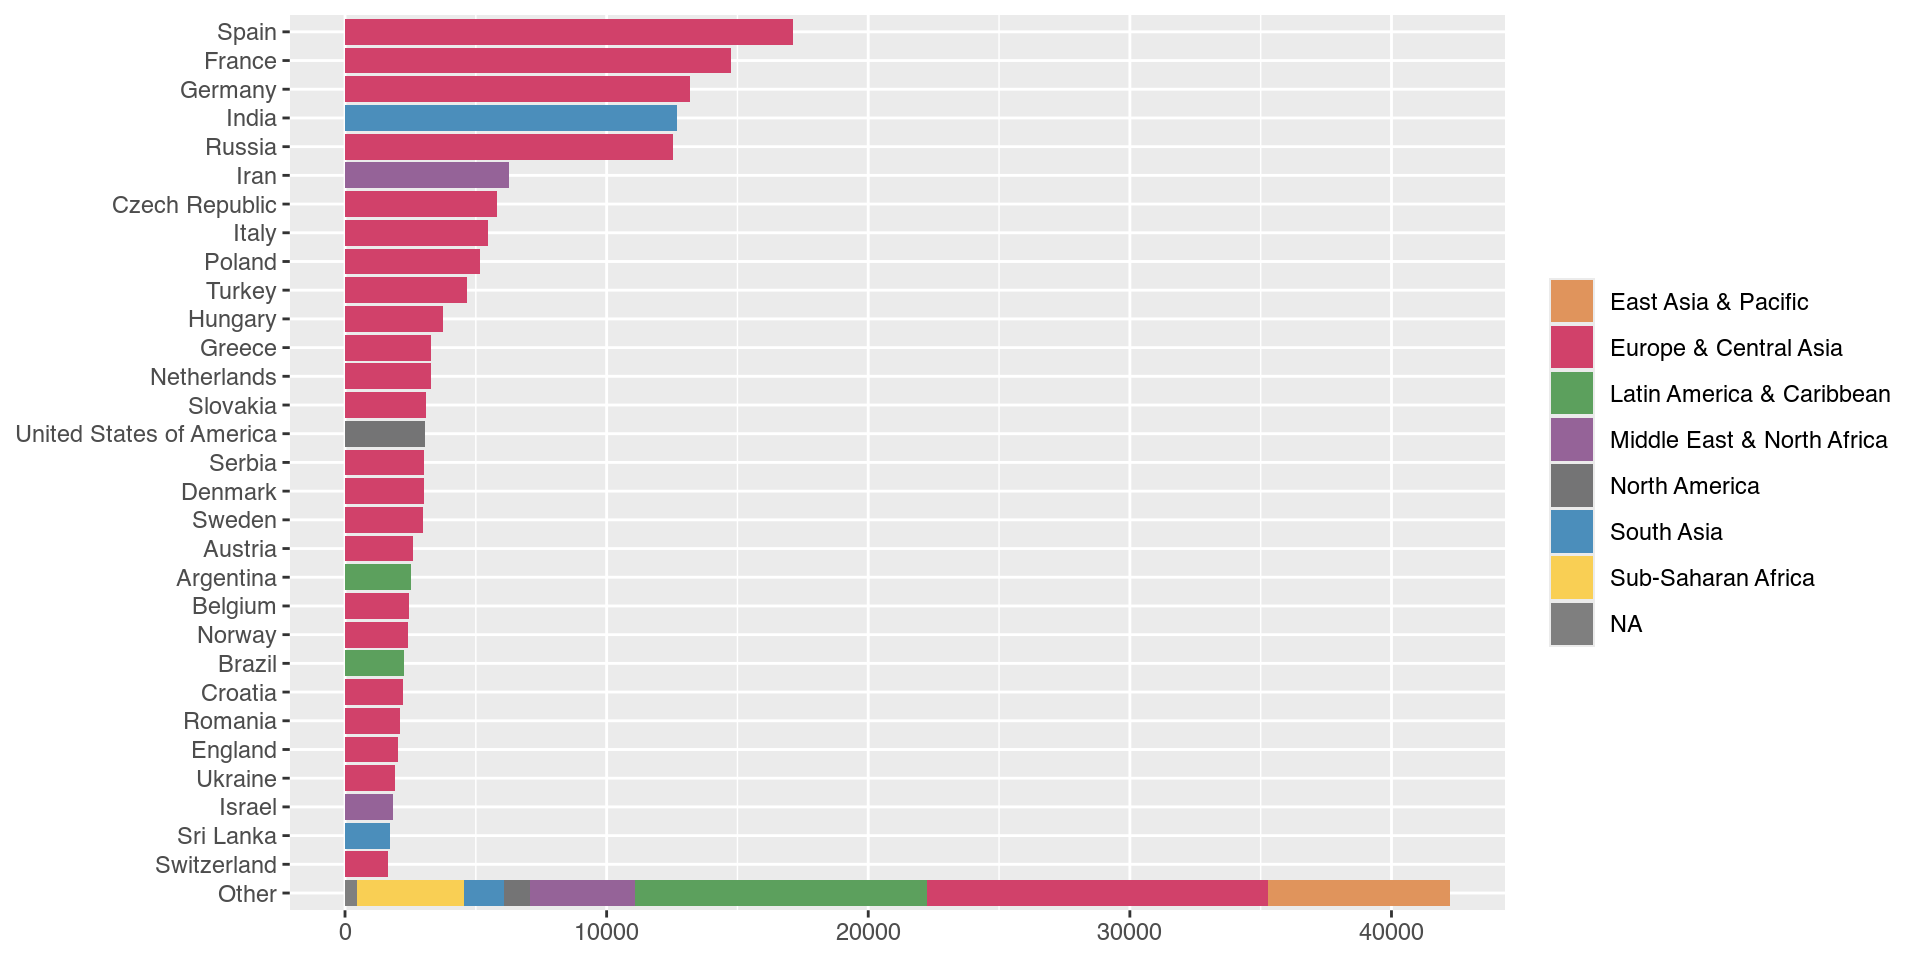
Fig 8.12 ’Grandmasters and active rated players per million population,
circle areas are proportional to country population sizes
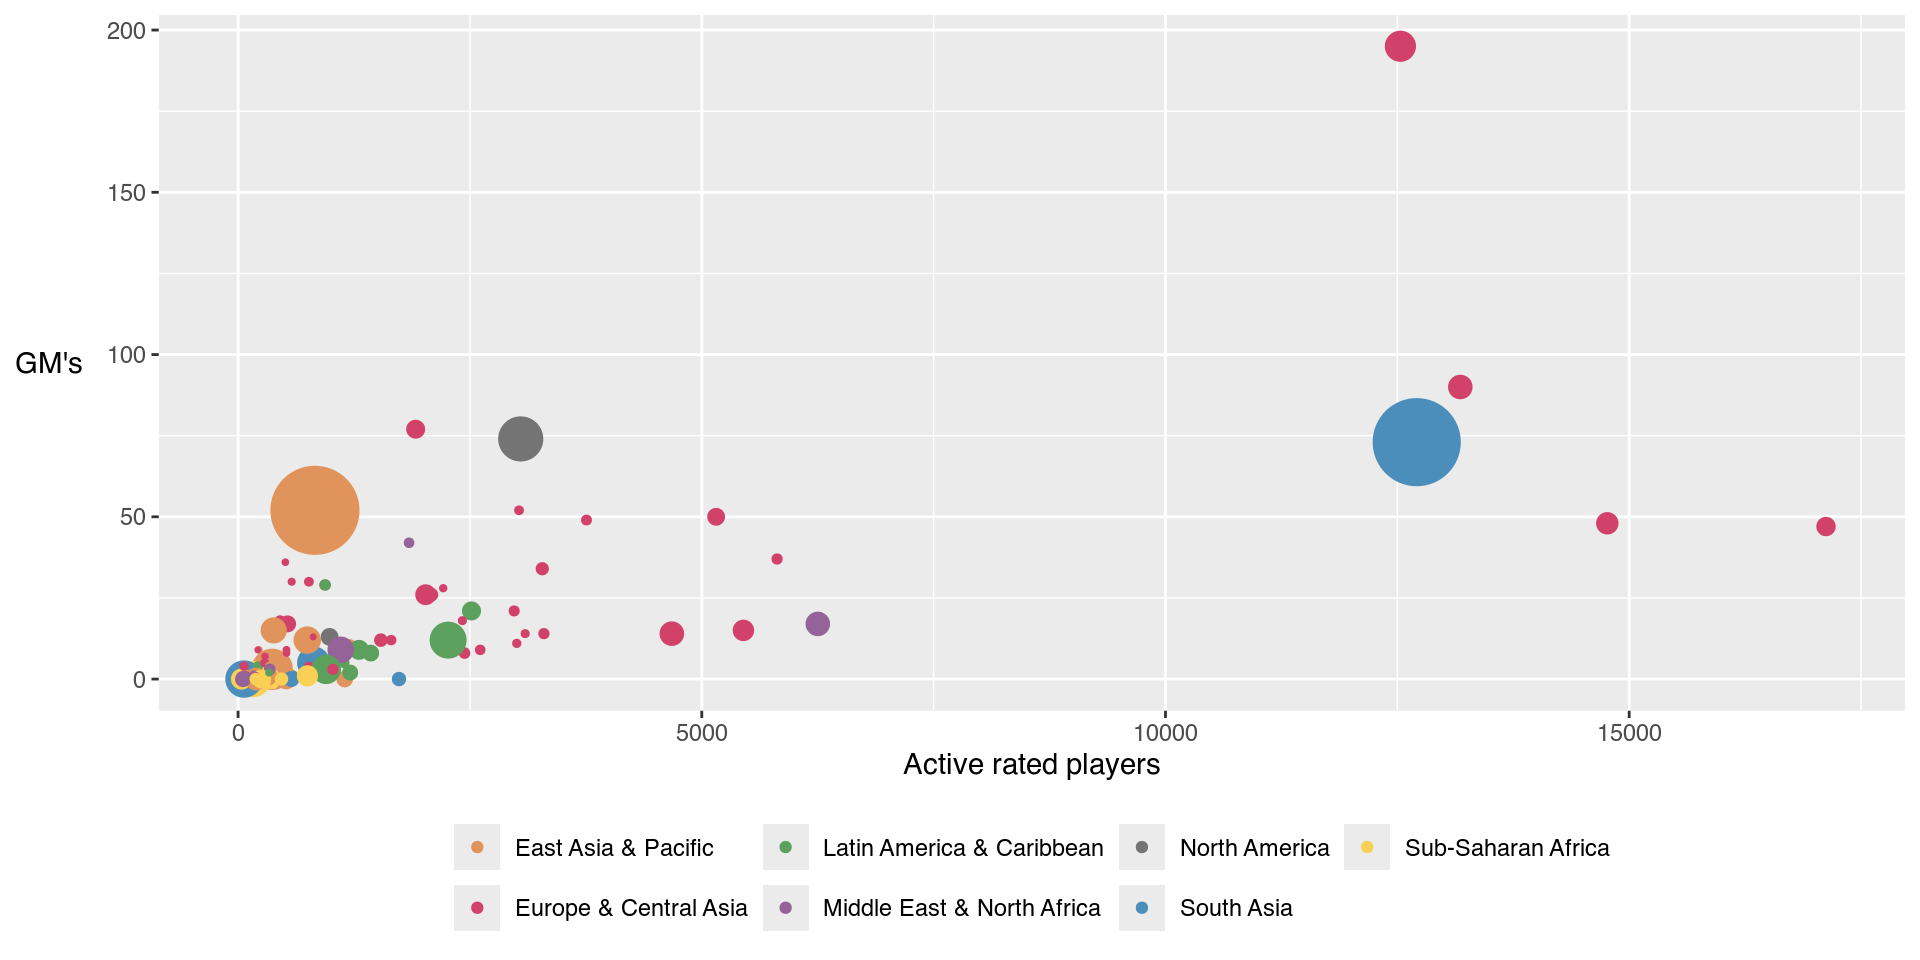
Fig 8.13 ‘Chess ratings of active players for countries with over 3000 active’
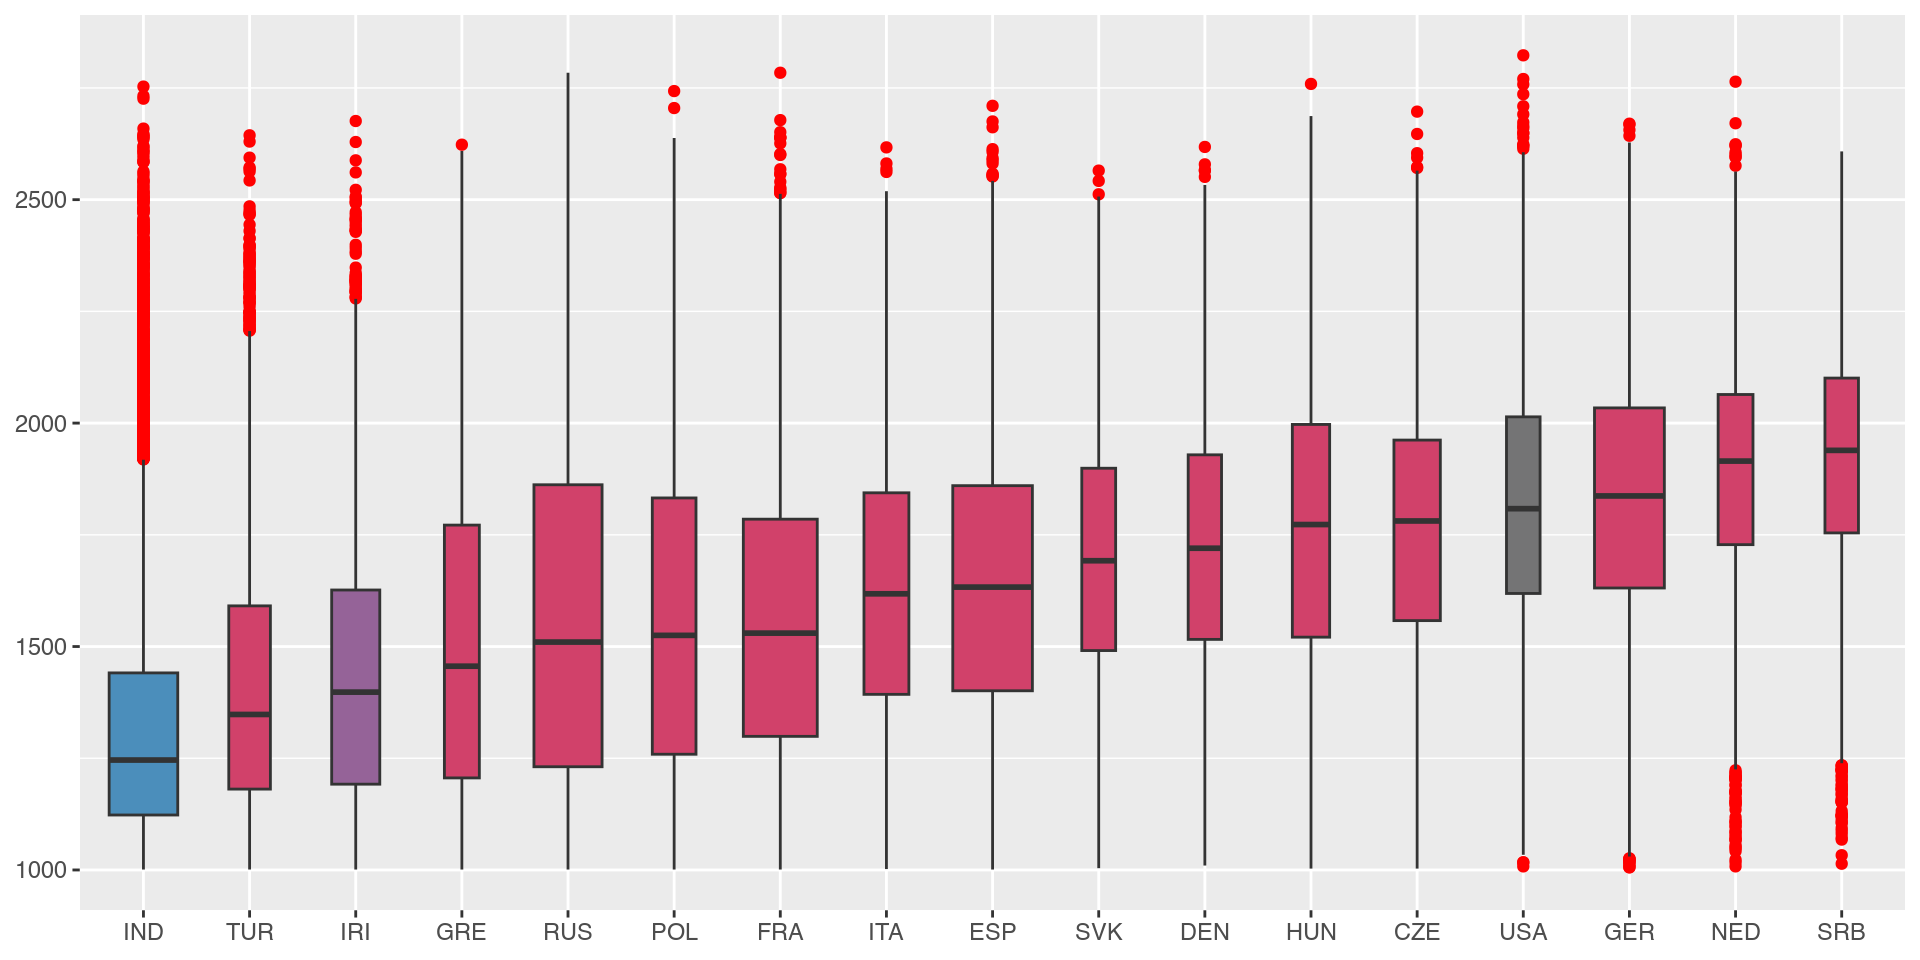
Fig 8.14 ‘Density estimates of distributions of ratings in December 2015 and December 2020’
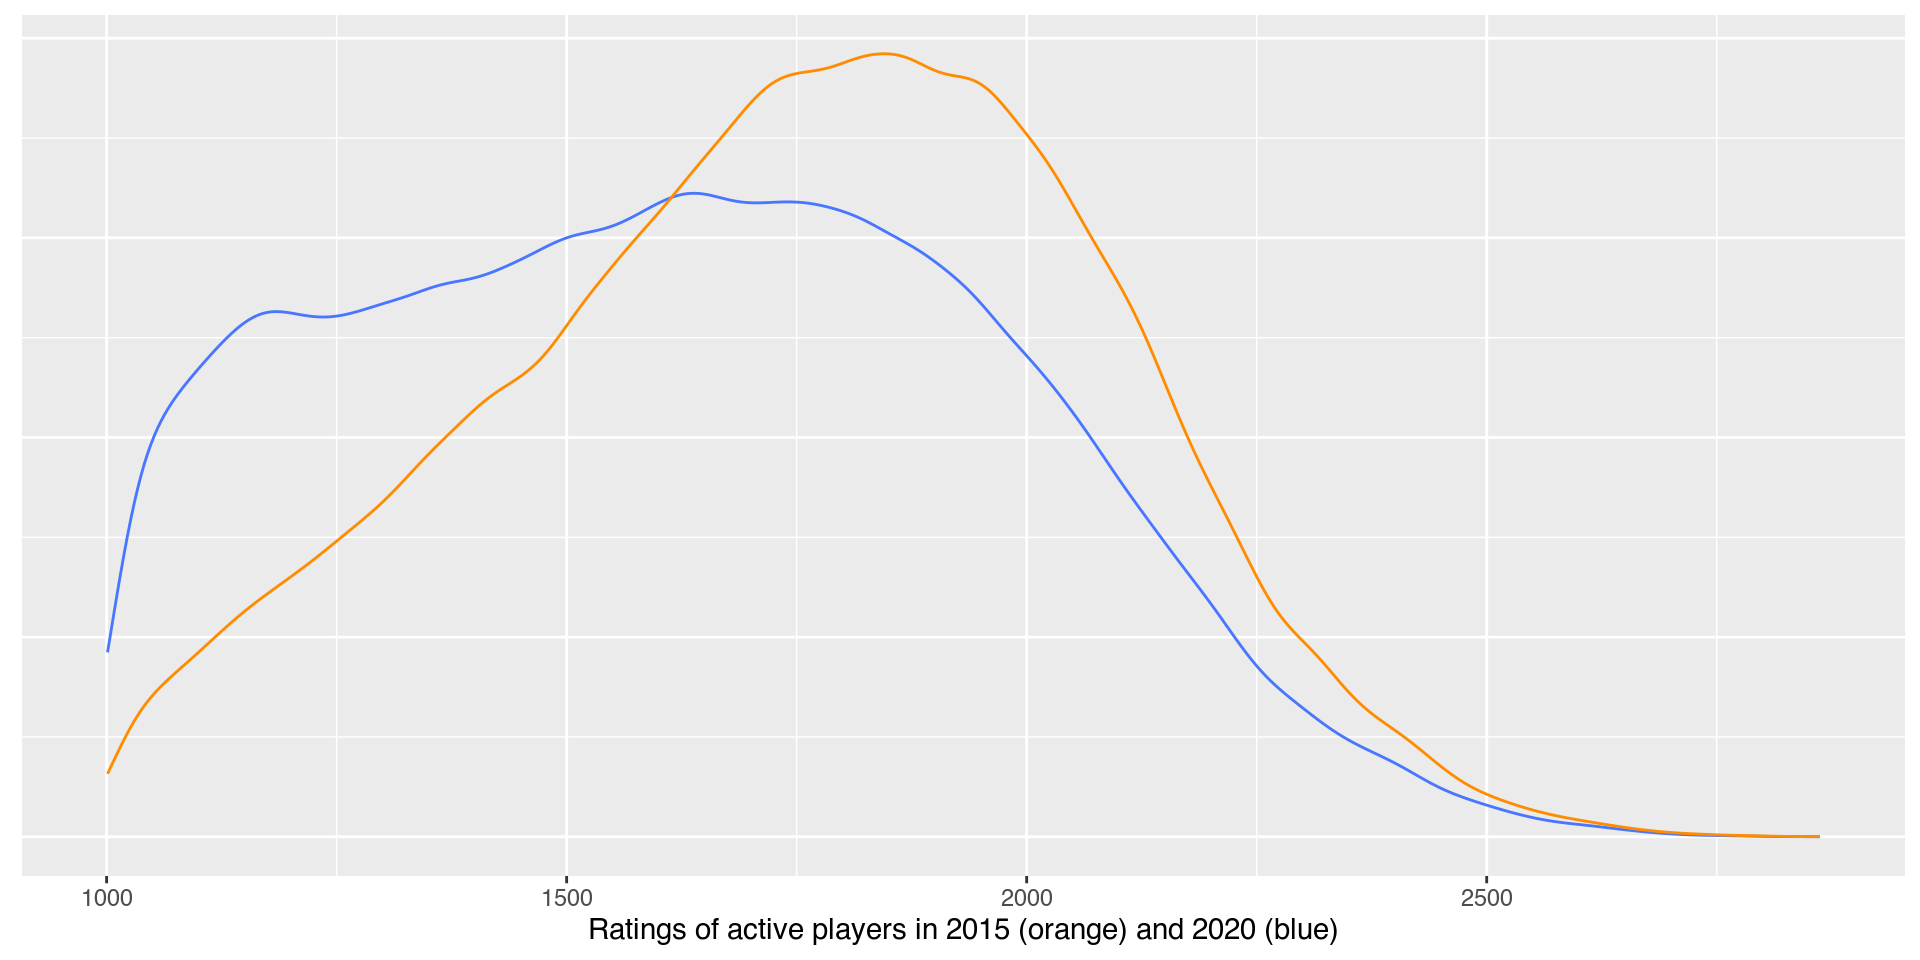
Fig 8.15 ‘Density estimates of active players' ages in 2015 and 2020’
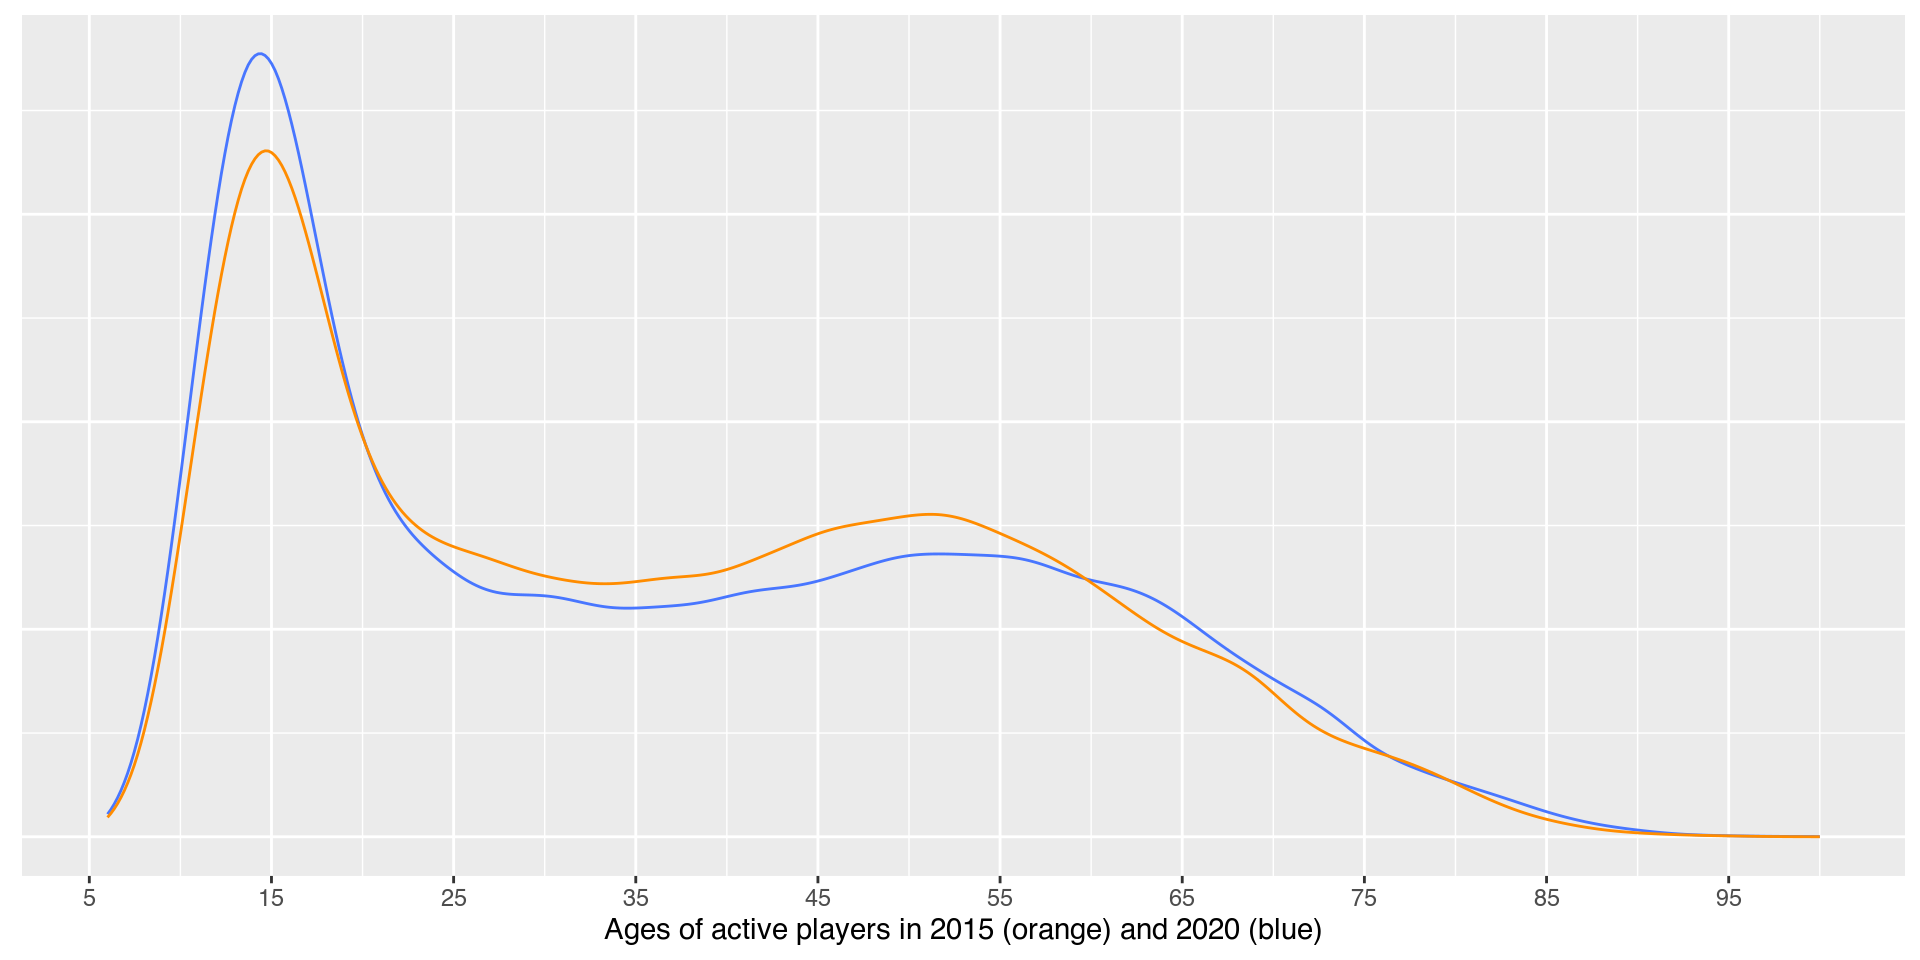
Fig 8.16 ’Rating by age for active players in 2015
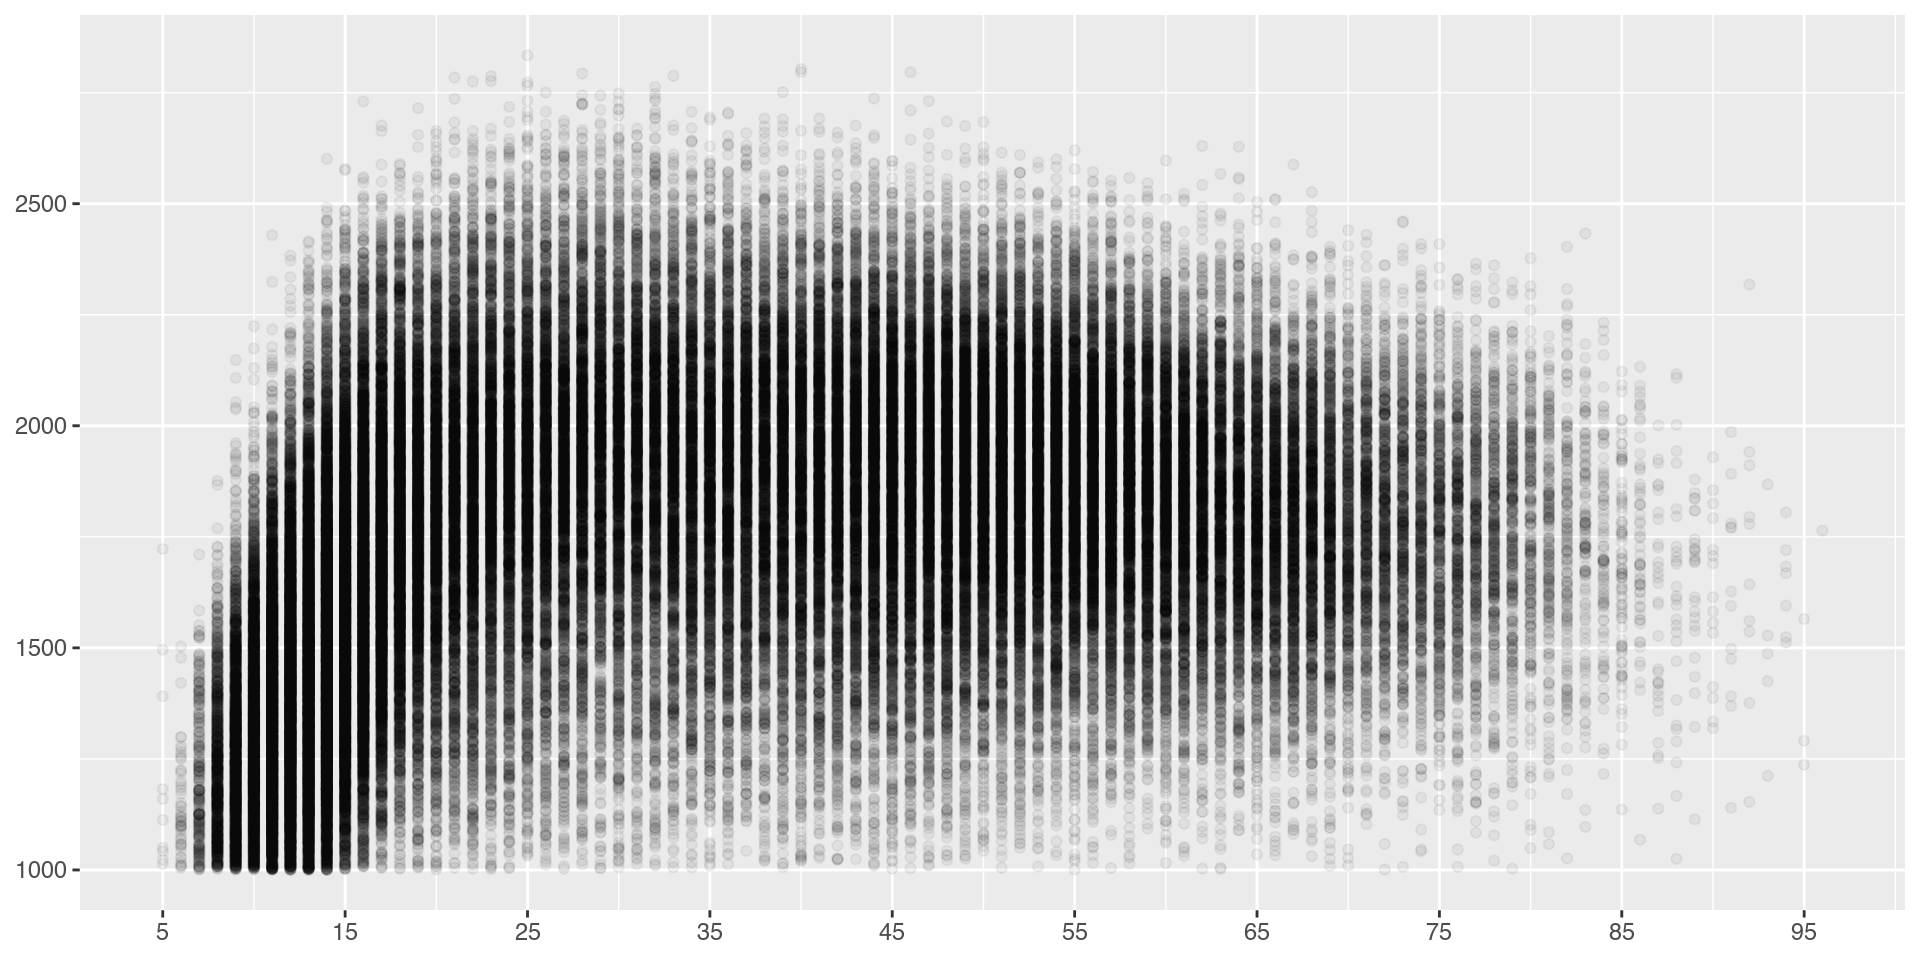
Fig 8.17 ‘Rating by age for active players in 2015’
(players with ratings over 2700 are colored red and an alpha value of 0.01 has been used for the others)
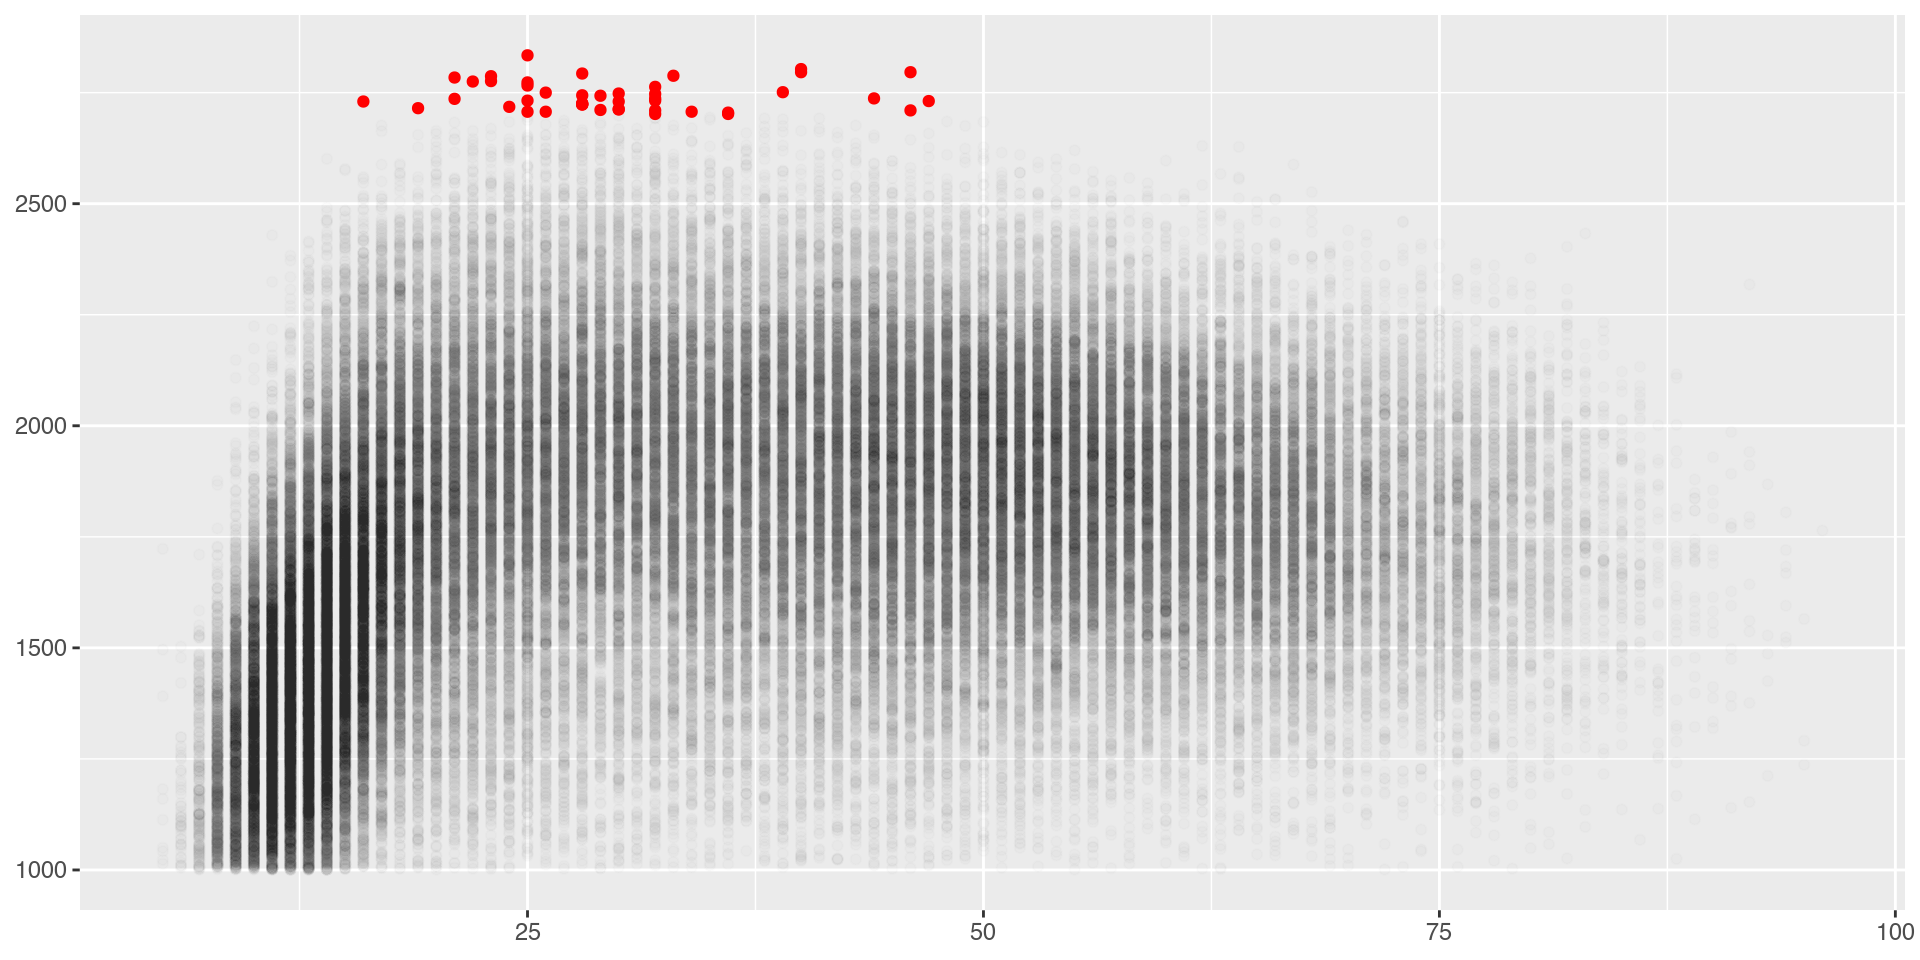
Fig 8.18 Rating by age for a 10% sample of active players in 2015
with a nonlinear smooth and confidence band
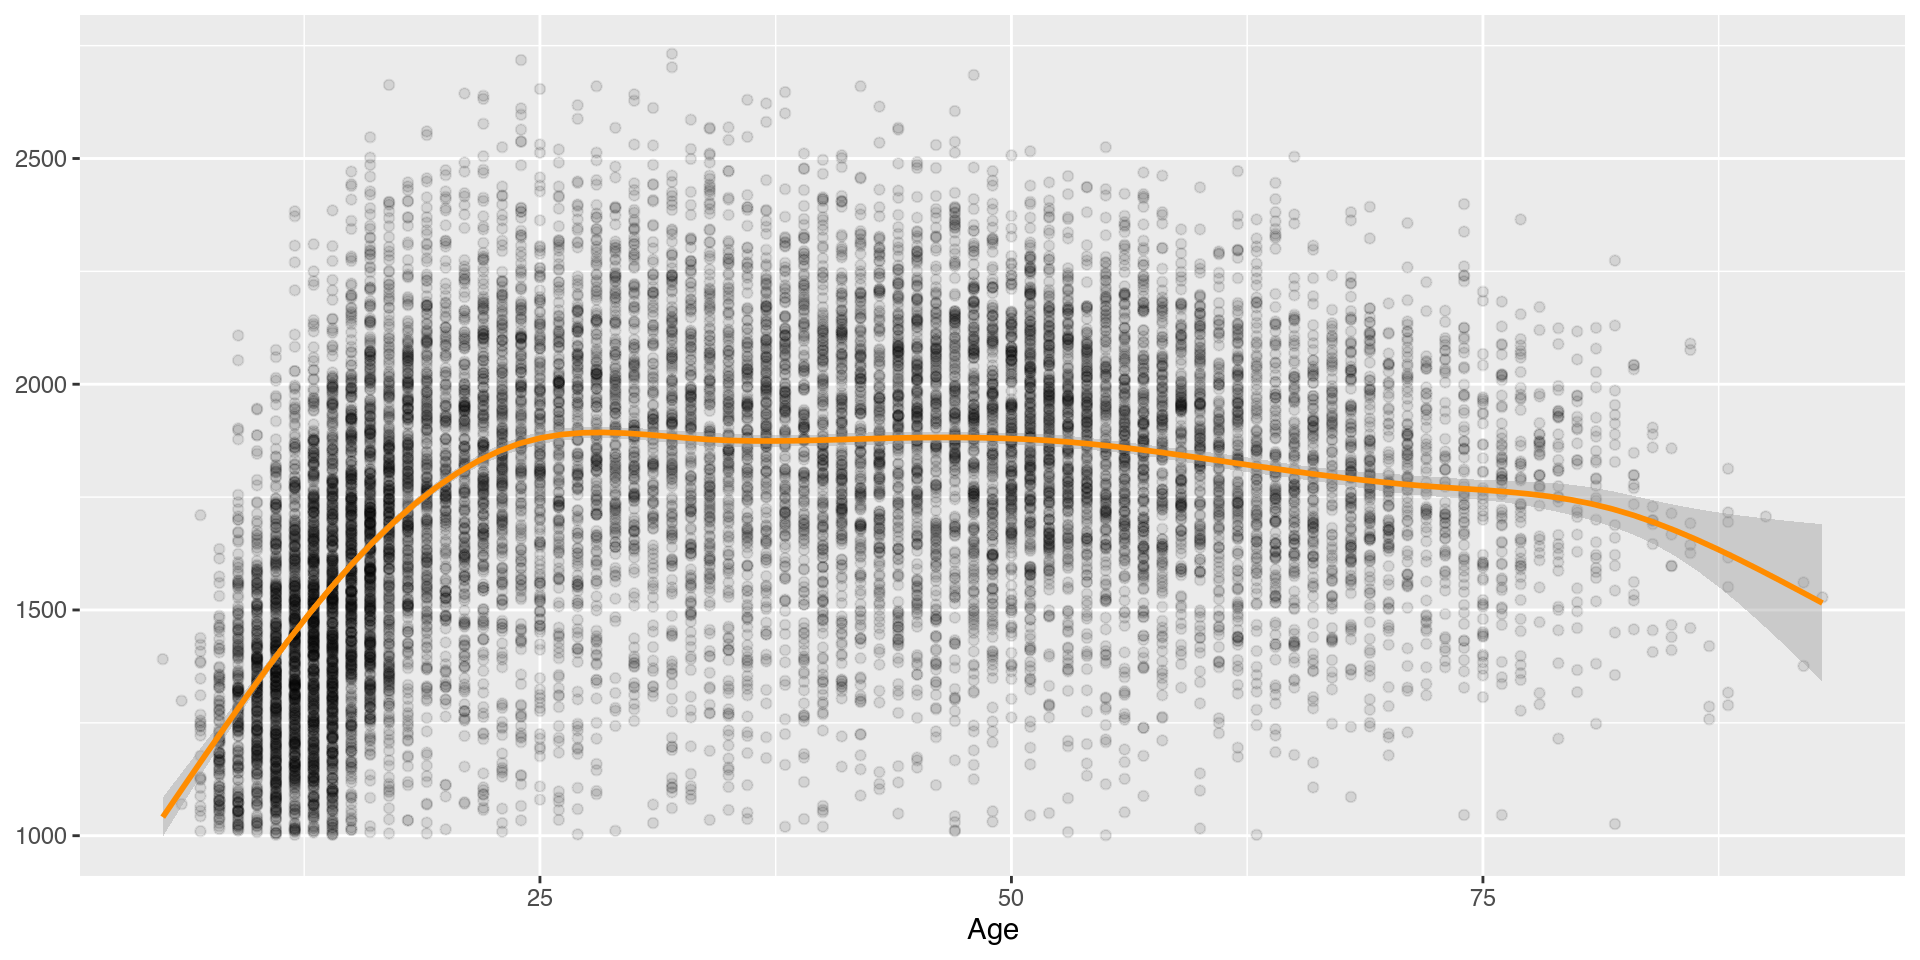
Fig 8.19 ‘Boxplots of ratings by age for active players in 2015’
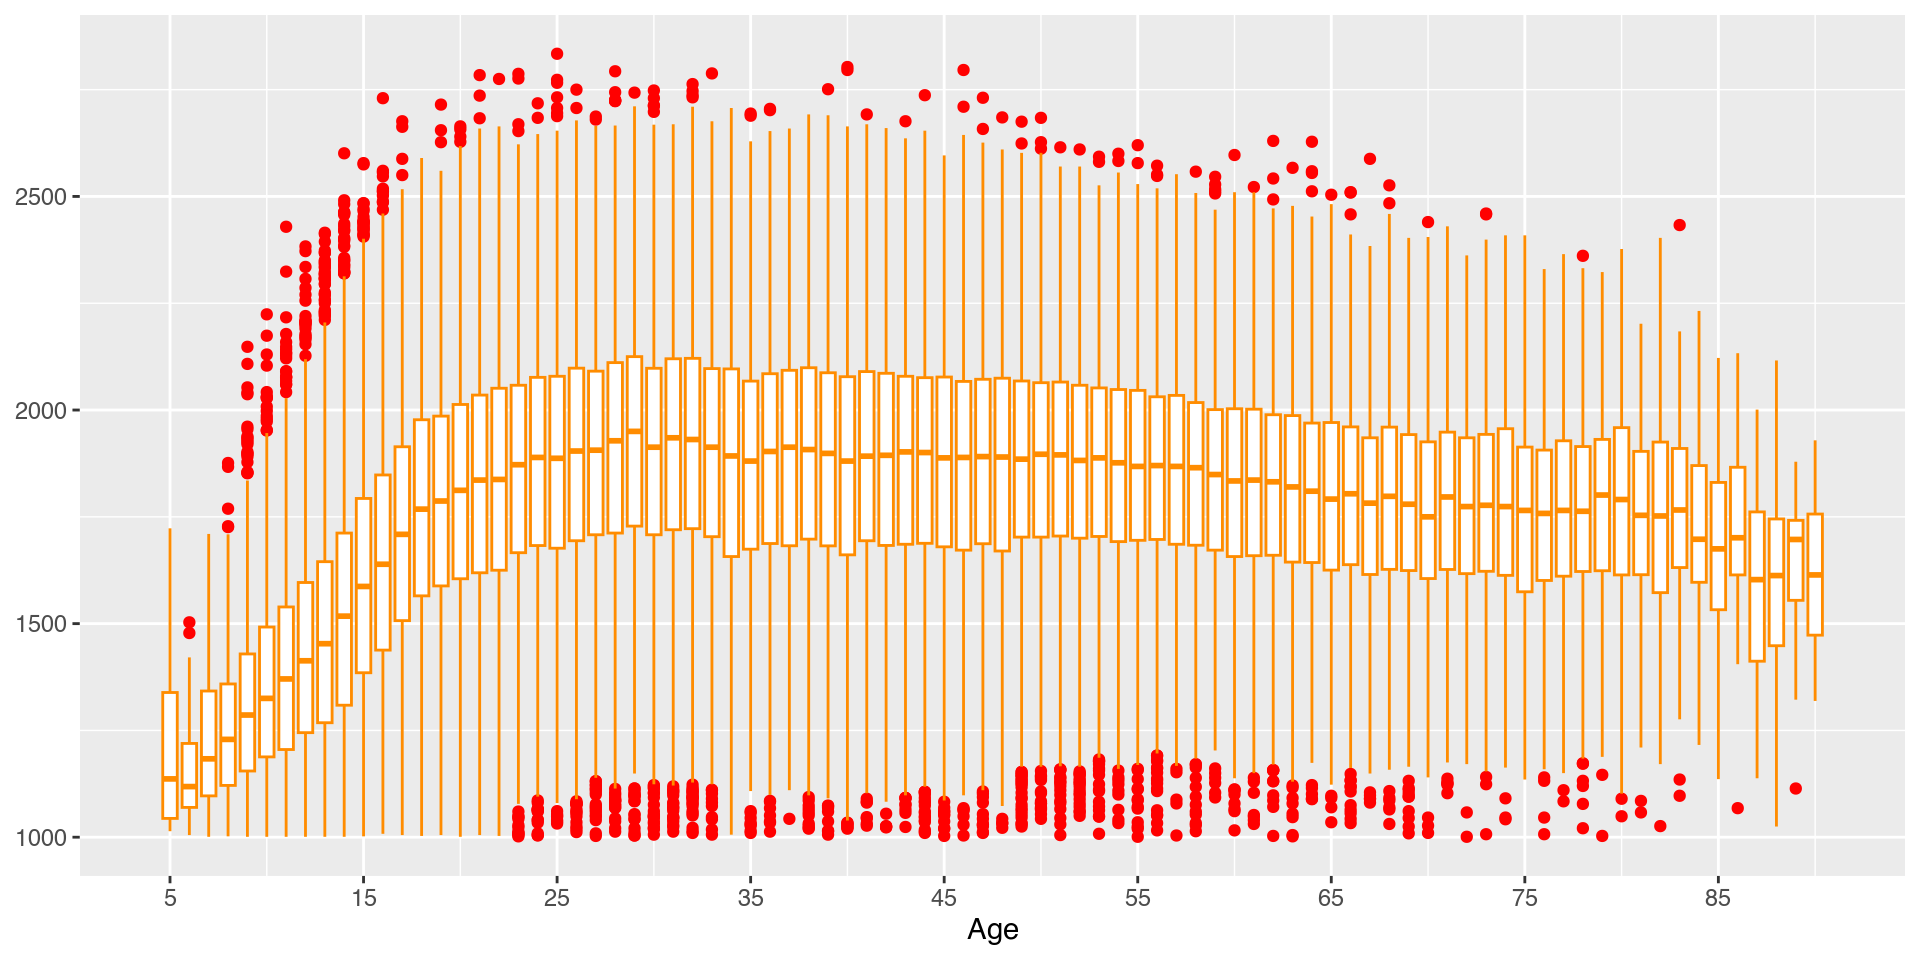
Fig 8.20 Ridgeplots of ratings for active players in 2015’
for ages from 15 to 65 in 5 year jumps
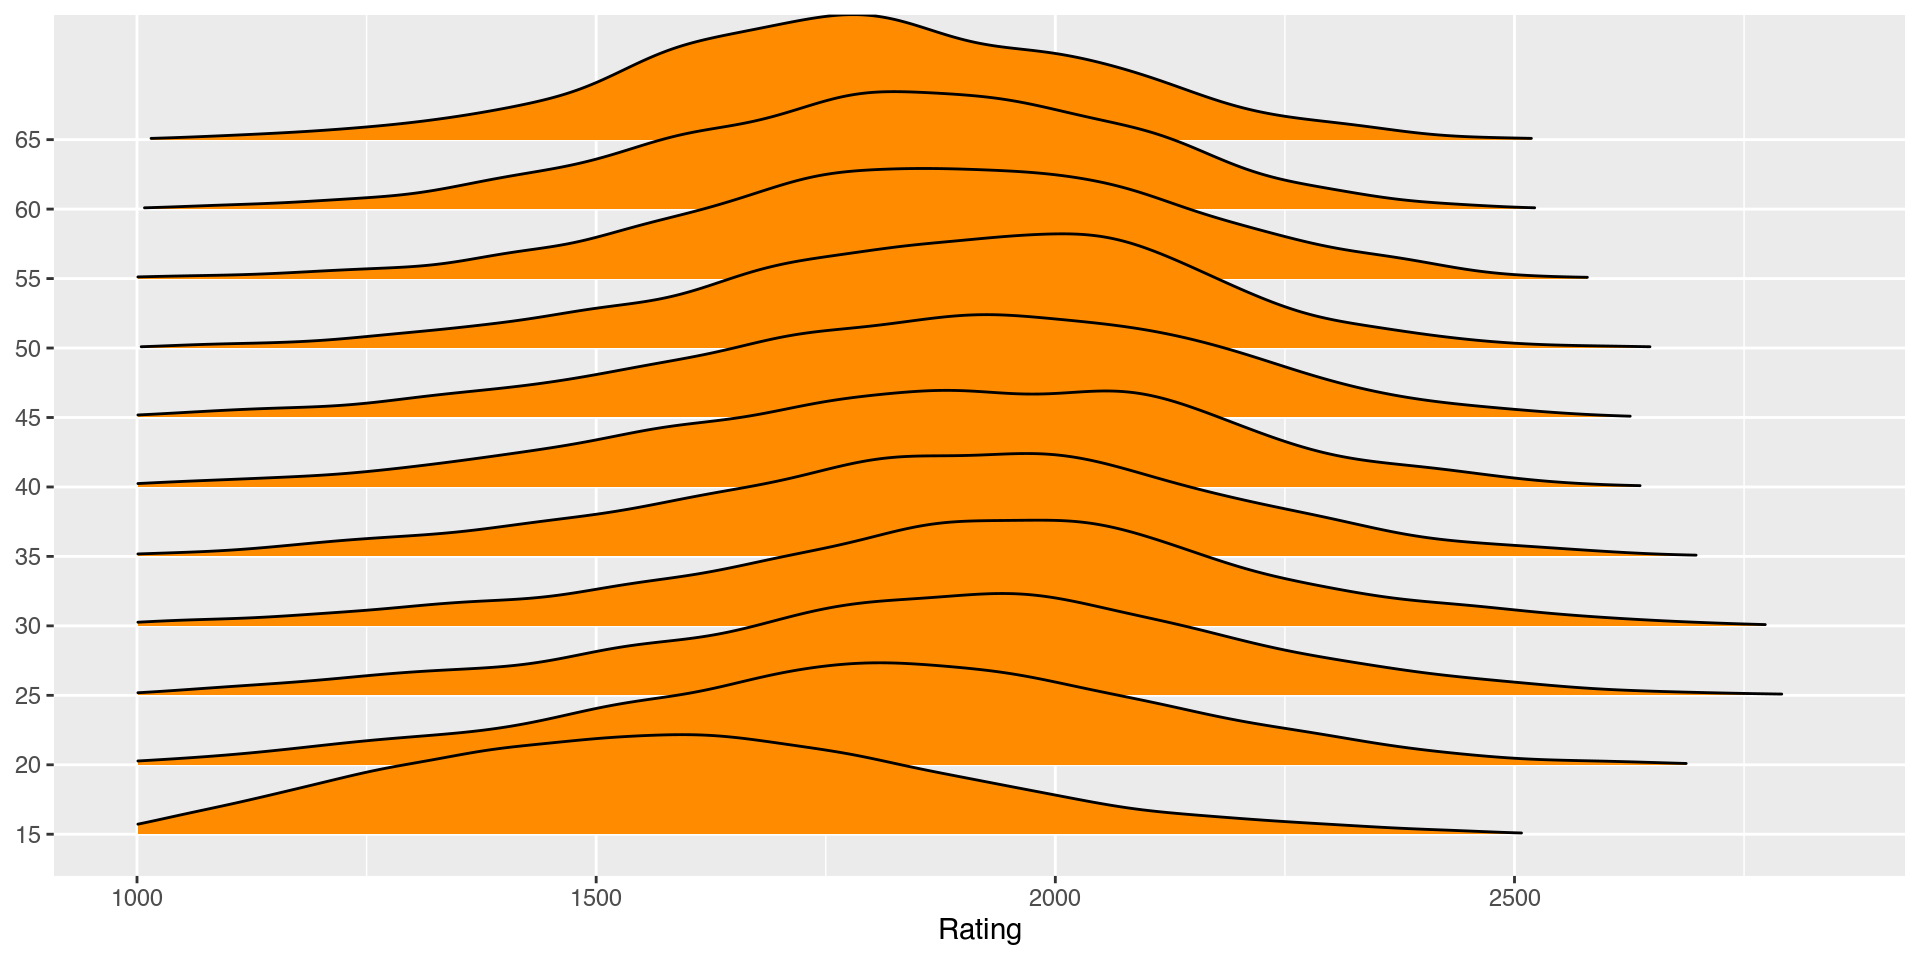
Fig 8.21 ‘Rating by age for active players in 2015 and 2020’
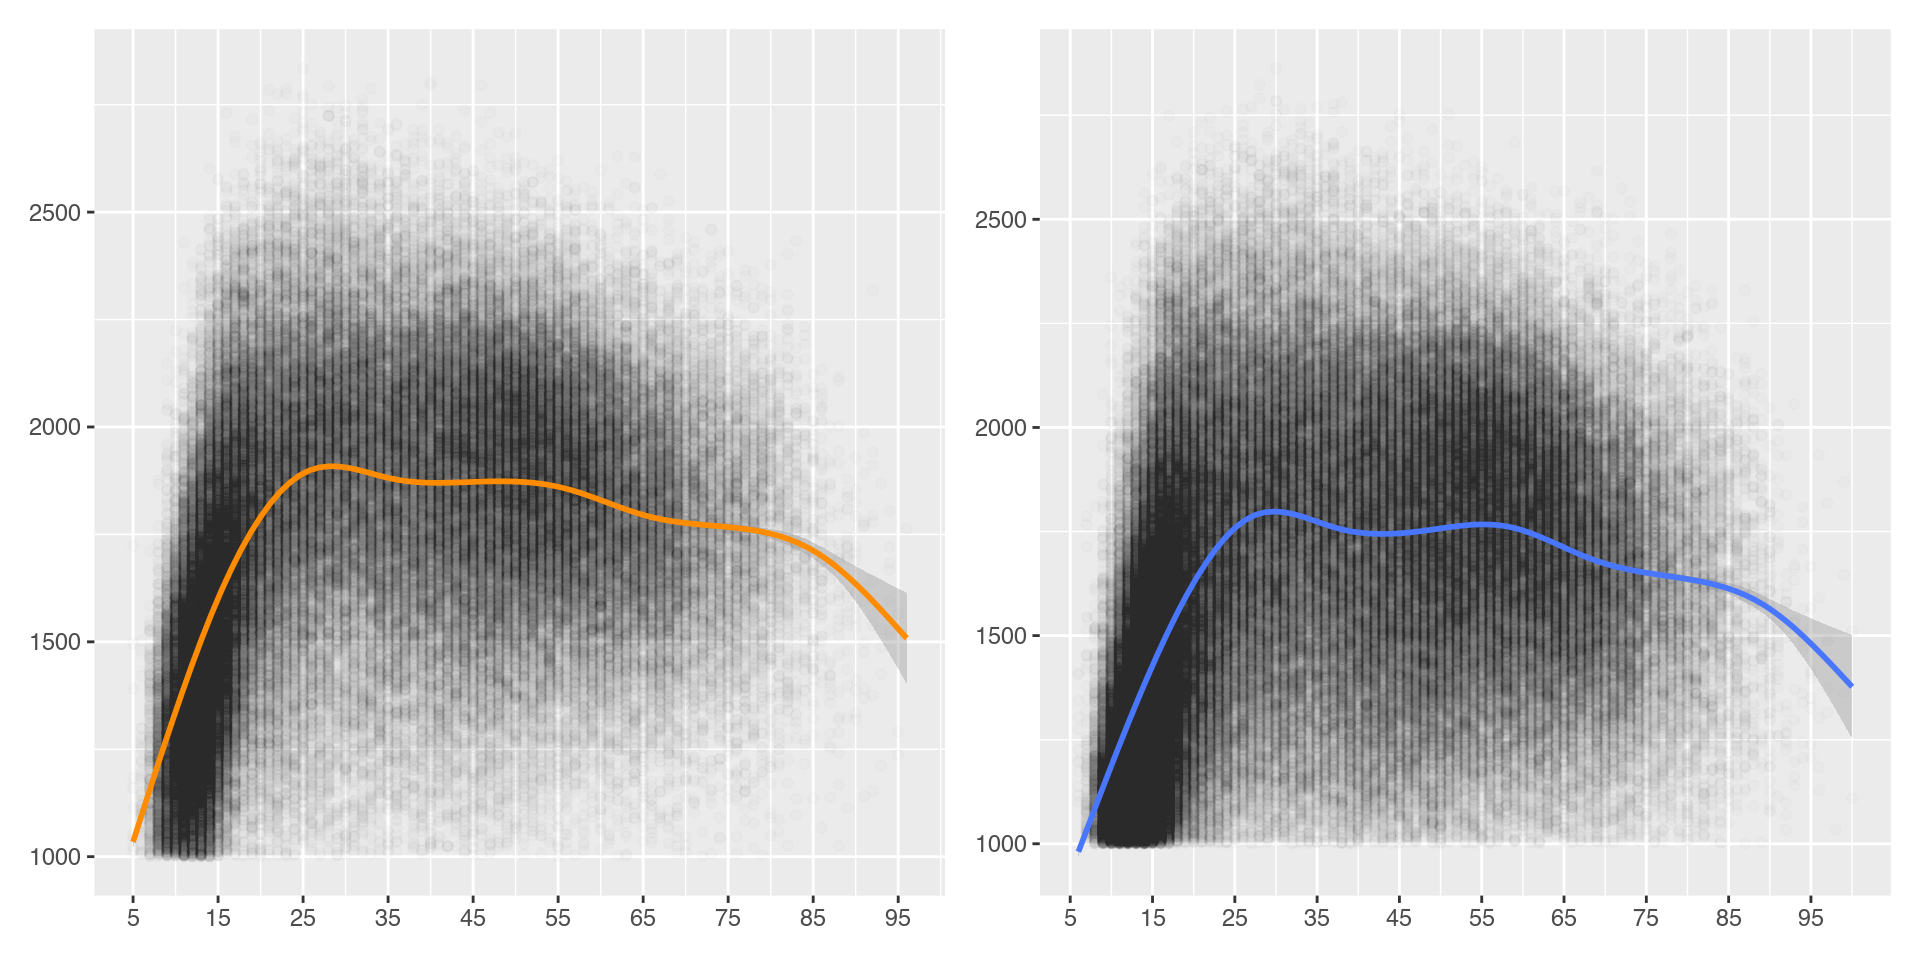
Fig 8.22 ‘Smooths for ratings by age for active players in 2015 and 2020’
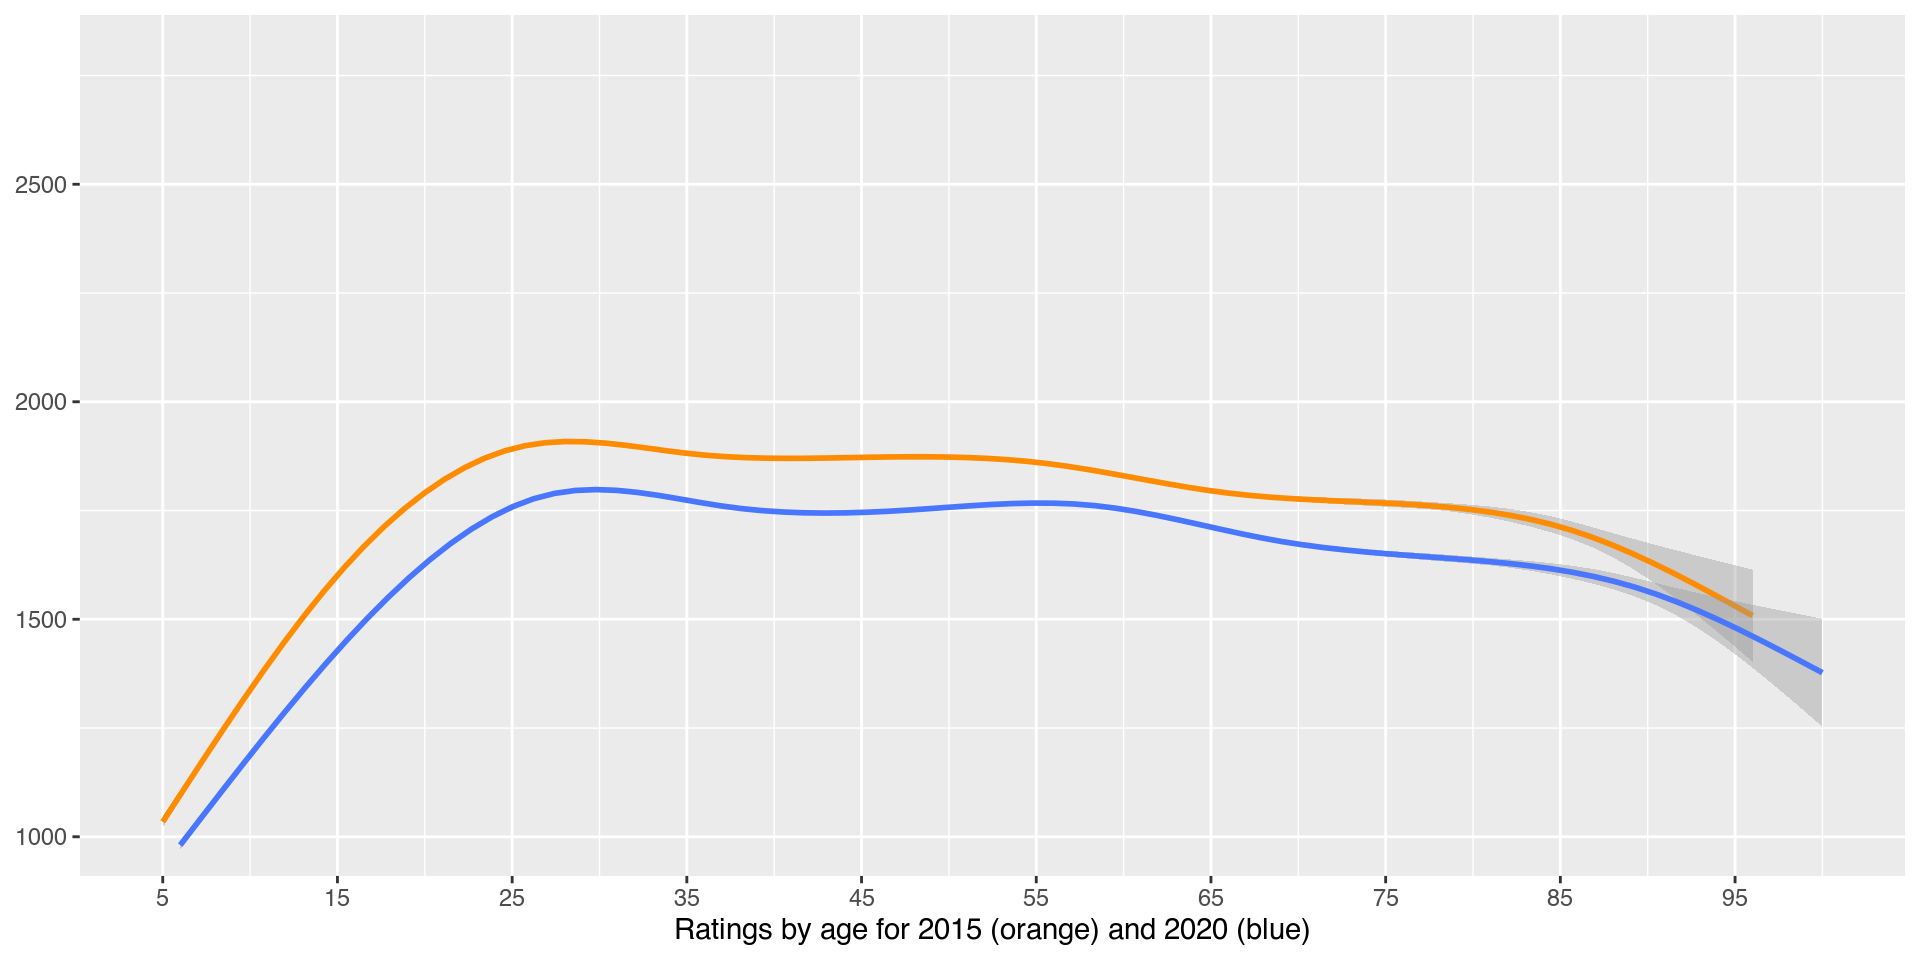
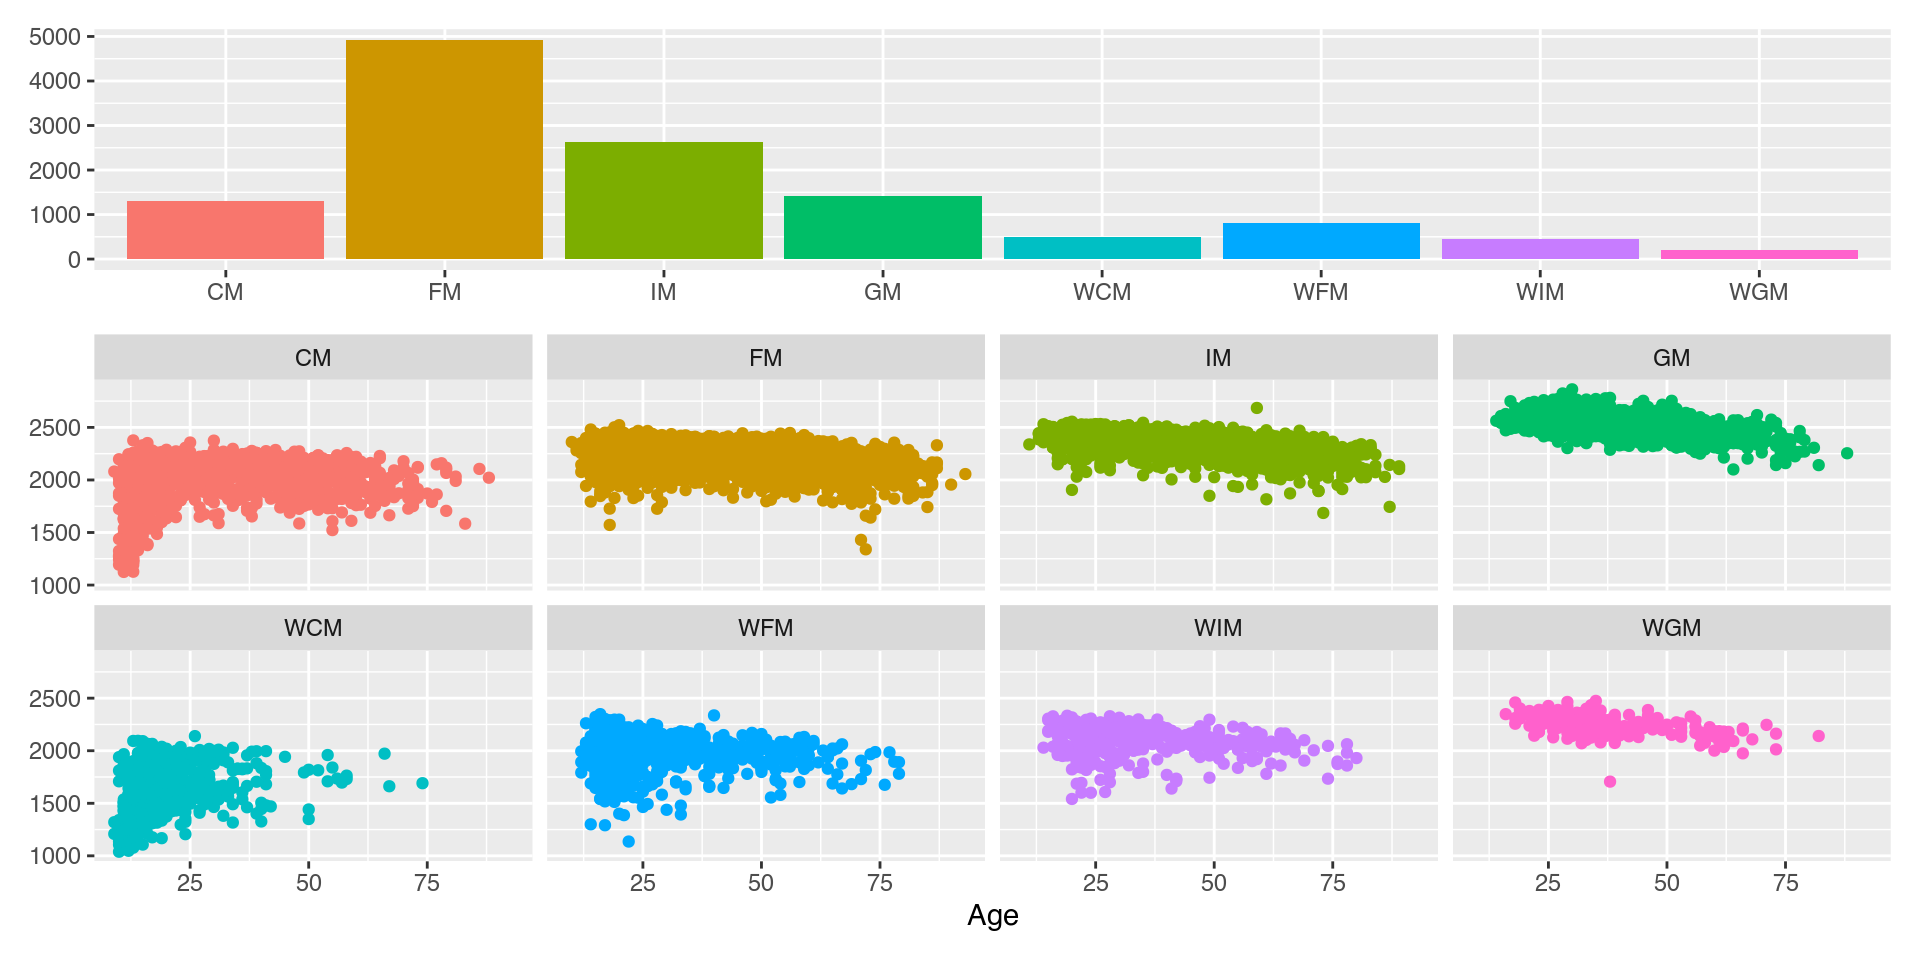
Fig 8.23 ‘Numbers of active titled players and their ratings by age’