Countering Statistical Misconceptions
Regression
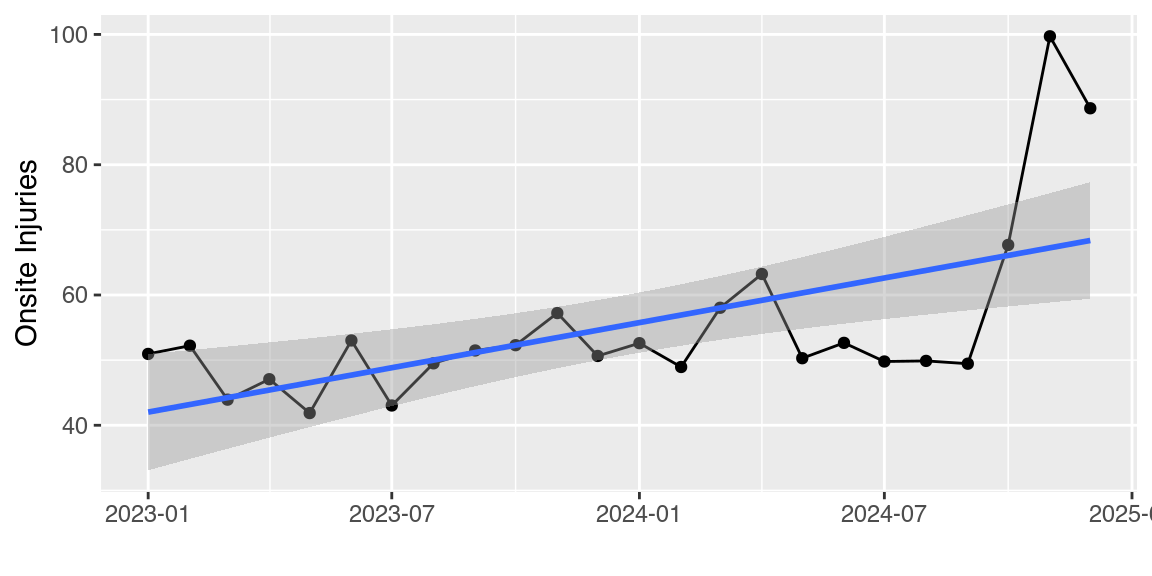
📐 Engineers
- “Oh no, there’s been a huge increase in injuries! We need to do something now, before the problem gets worse!”
🤣 Statisticians
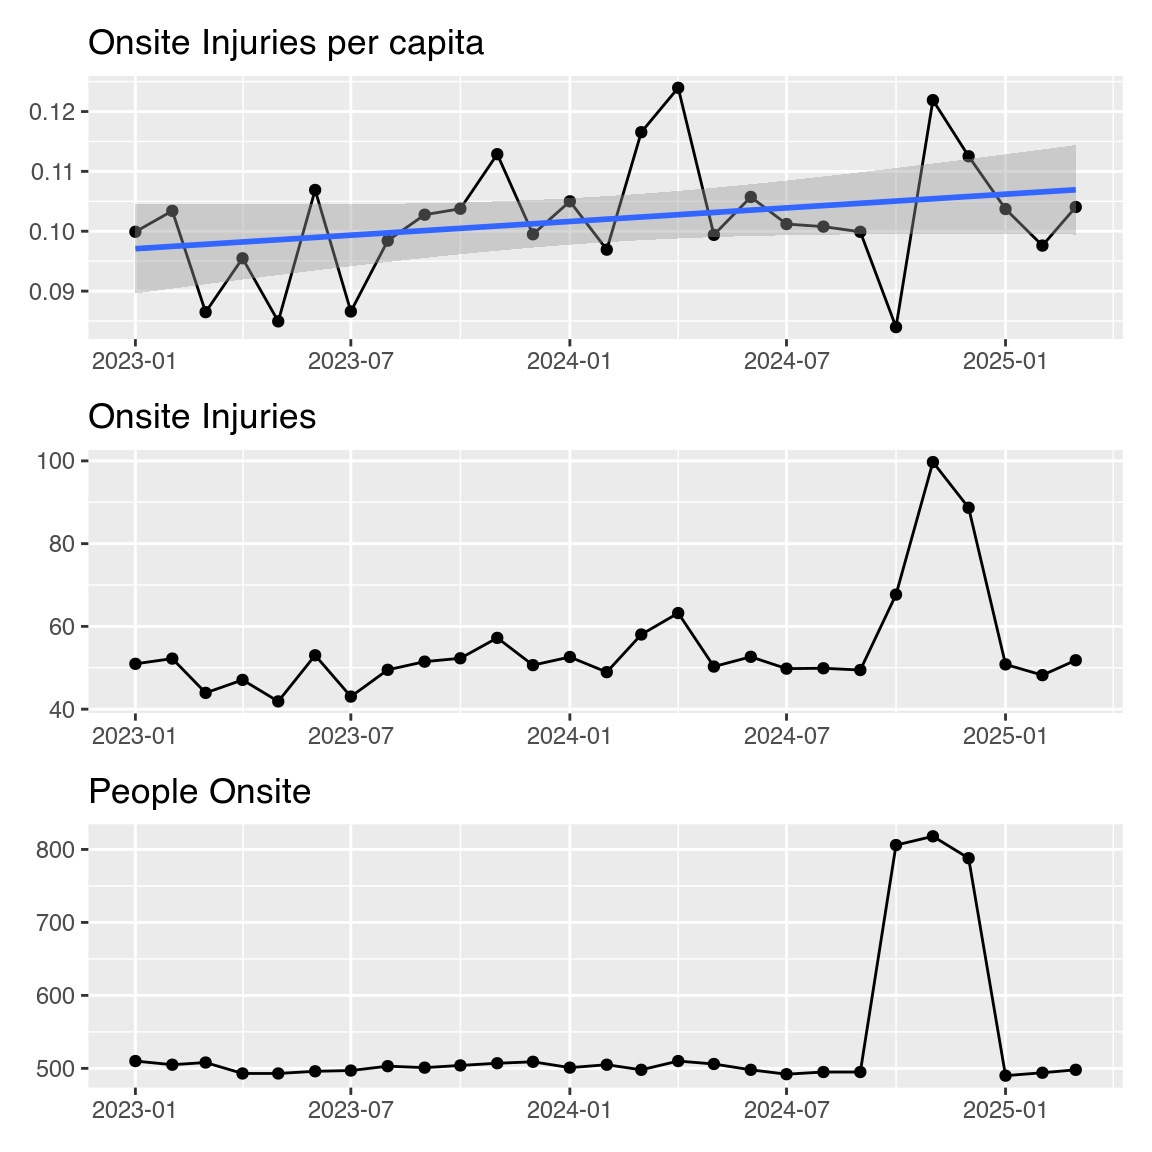
linear regression isn’t the right tool for this
have you considered other explanations?
let’s add more data…
P-values
Misconception: Small p-value => Bigger effect size
T-test between \(x_1 \sim N(0, 1)\) and \(x_2 \sim N(1, 1)\)
True \(\mu_2-\mu_1 = 1\), \(\eta = 1\)
![Two histograms showing p-values for 500 simulations of 50 samples per group, with a mean difference between groups of 0 (left) and 1 (right). On the left, the p-values are approximately uniformly distributed, with 0-10 observations for each of 100 bars. On the right, almost all observations are in the left-most bucket corresponding to [0, 0.01].](09-misconceptions_files/figure-revealjs/unnamed-chunk-3-1.png)
Under \(H_0\), p-values are uniform(0, 1) distributed!
Within each panel, the effect size is the same.
P-values
Misconception: Small p-value => Bigger effect size
T-test between \(x_1 \sim N(0, 0.5)\) and \(x_2 \sim N(0.5, 0.5)\)
True \(\mu_2-\mu_1 = 0.5\), \(\eta = 1\)
![Two histograms showing p-values for 500 simulations of 50 samples per group, with a mean difference between groups of 0 (left) and 2 (right). On the left, the p-values are approximately uniformly distributed, with 0-10 observations for each of 100 bars. On the right, all observations are in the left-most bucket corresponding to [0, 0.01].](09-misconceptions_files/figure-revealjs/unnamed-chunk-4-1.png)
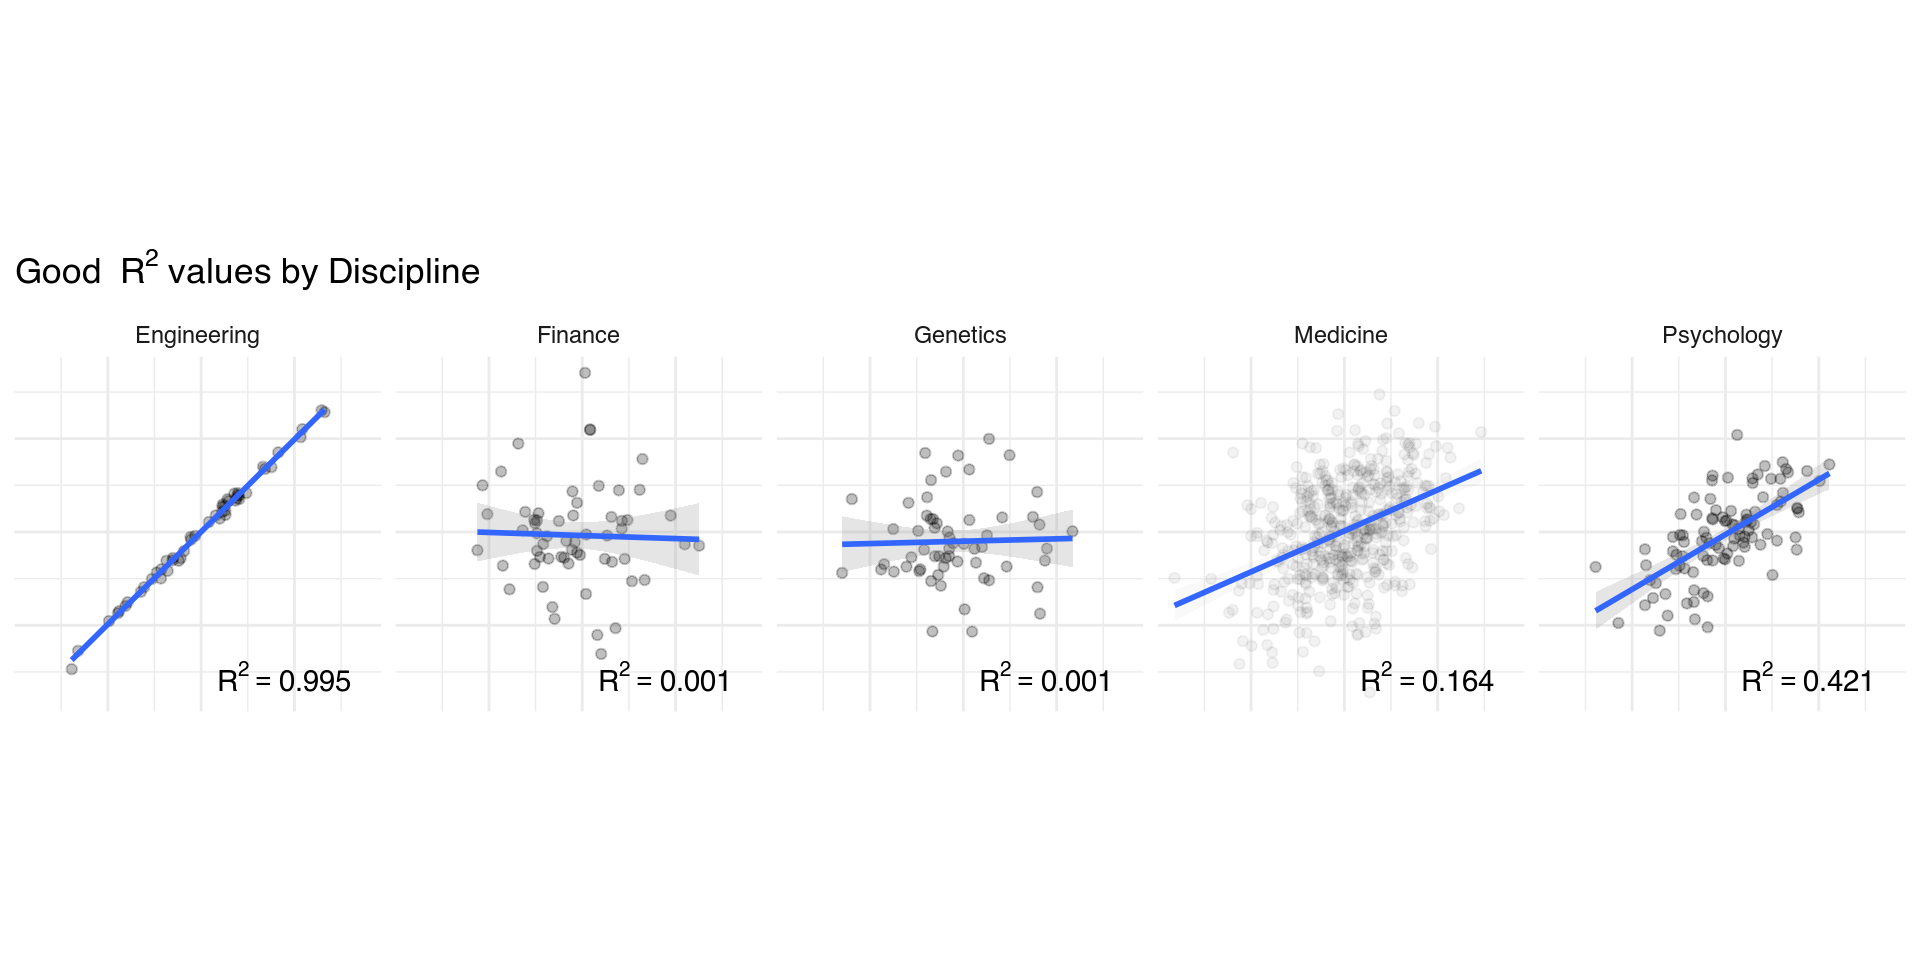
R^2
As number of predictors increases in multiple regression, \(R^2\) only increases. Adjusted \(R^2\) accounts for this issue.
Good \(R^2\) are different for different fields…
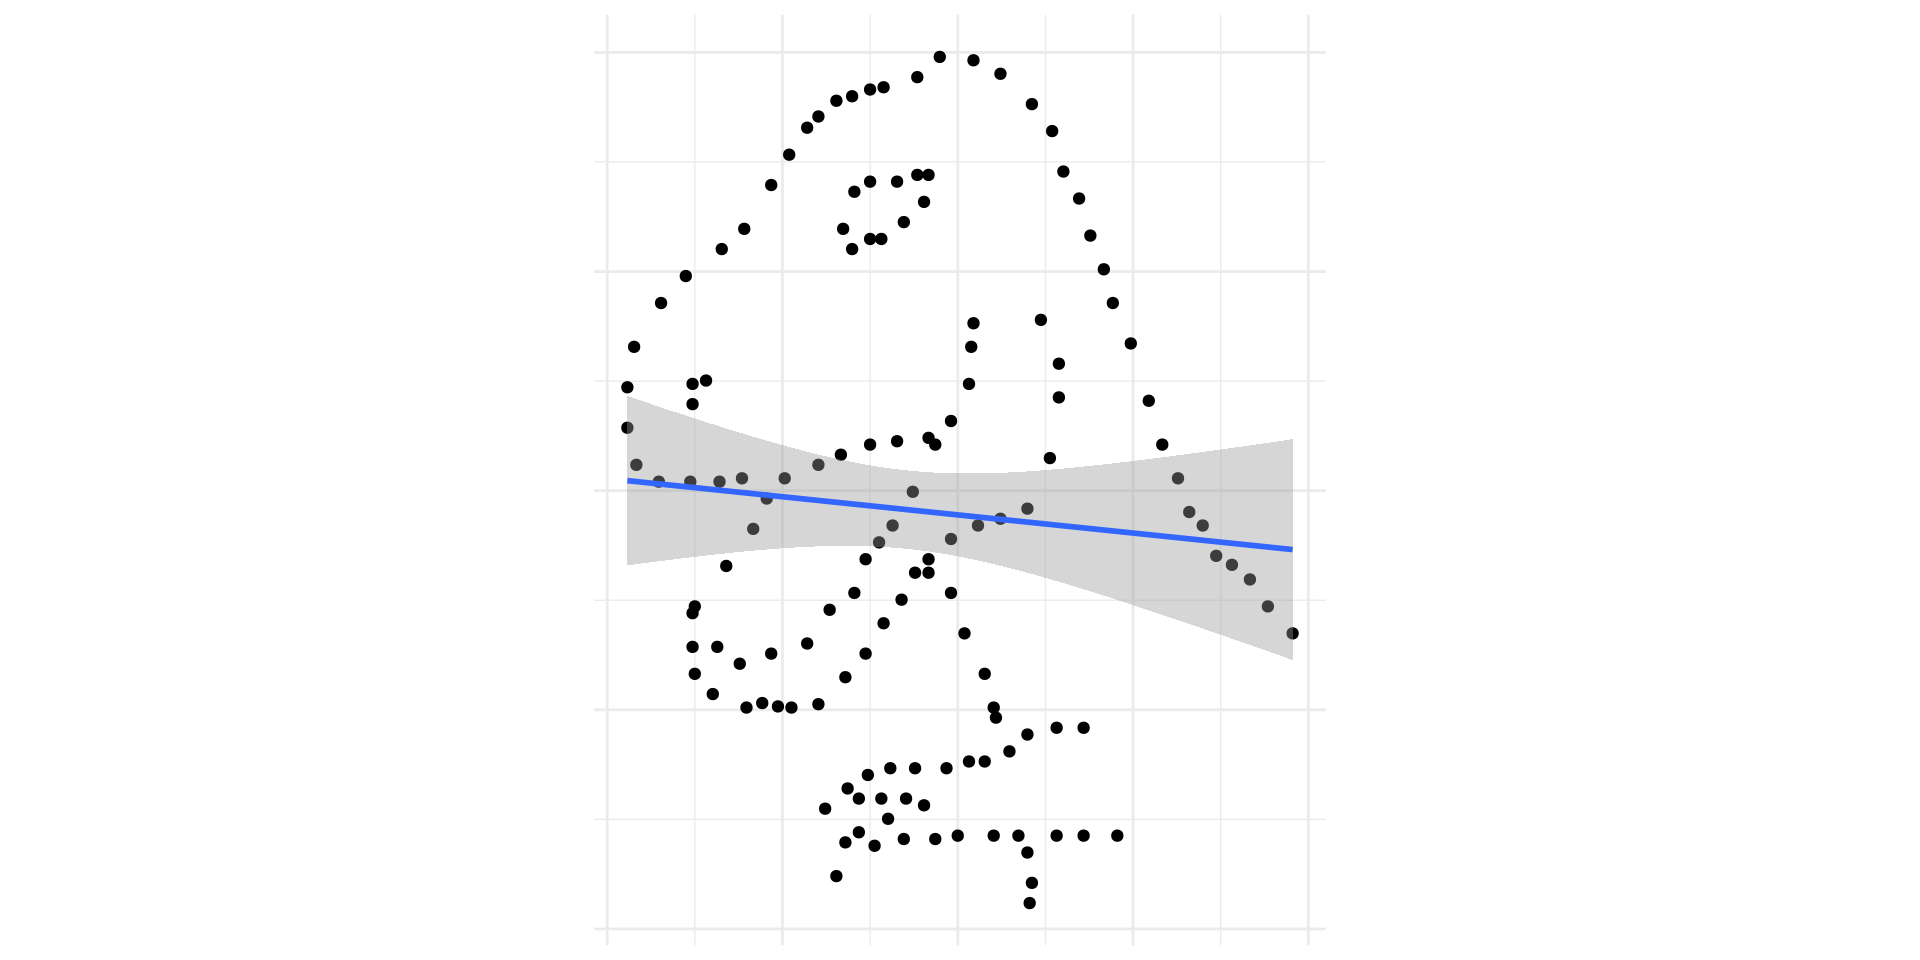
R^2
\(R^2\) only measures linear relationships
Not all interesting relationships are linear
Simpson’s Paradox
Kidney stone treatment experiment: Treatments A and B. Recorded stone size (large, small) and outcome of the treatment (success, failure).
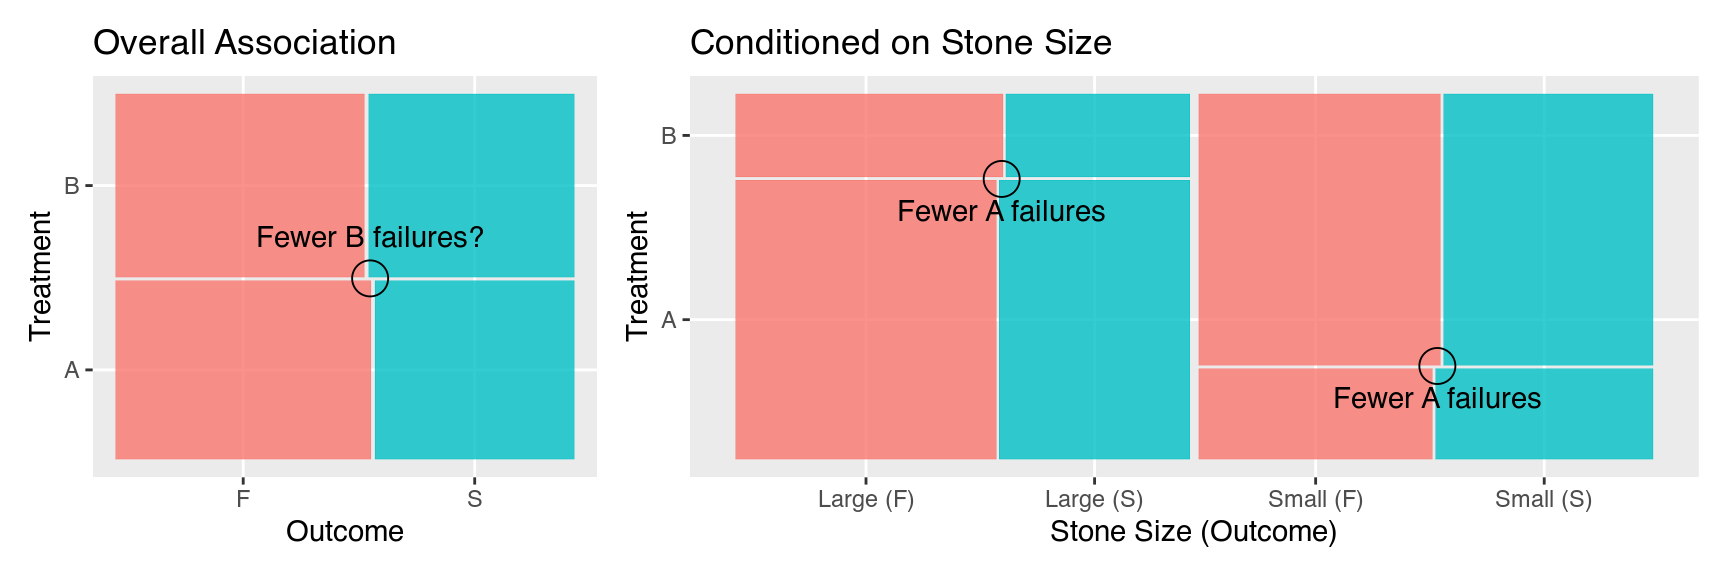
Failure to account for moderating variables can lead to the opposite (wrong) conclusion!
Make sure your model uses the available data
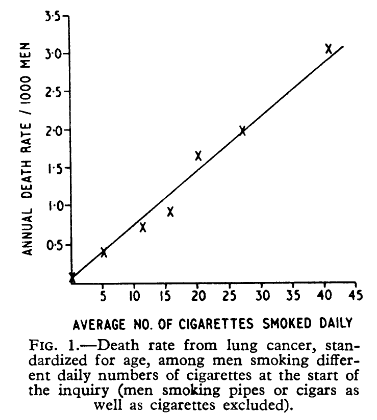
Representative Samples
1954
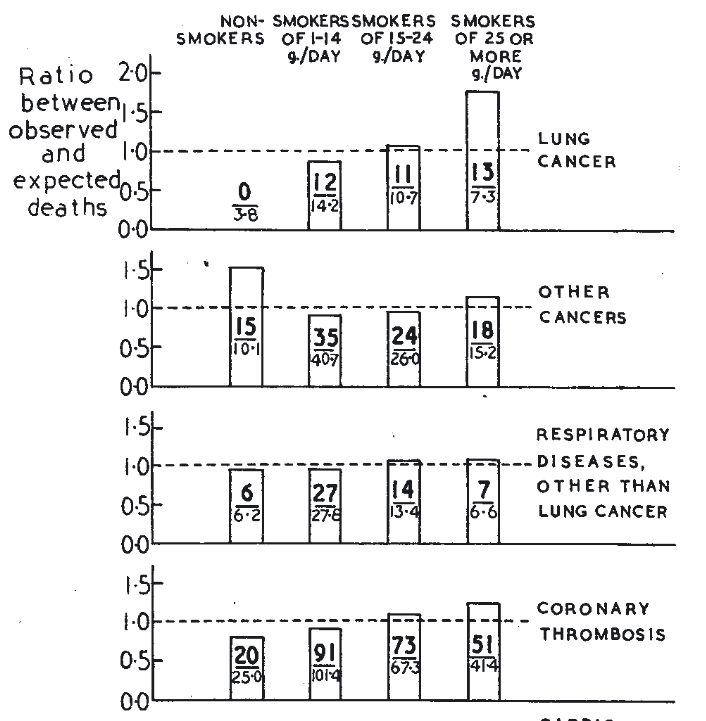
1964
Significance Testing

‘Detector! What would the Bayesian statistician say if I asked him whether the–’ [roll] ‘I AM A NEUTRINO DETECTOR, NOT A LABYRINTH GUARD. SERIOUSLY, DID YOUR BRAIN FALL OUT?’ [roll] ‘… yes.’
The null is MUCH MORE LIKELY than the alternative!
Manager Misconception Examples
Just rerun the experiment with a bigger sample size!
Statisticians can predict exactly what will happen next 🔮🪄🧙
It’s fine to pick the model you want to “win” and choose other models around it

Address these issues in person if at all possible. Try not to laugh or cry IN the meeting. If you post to Reddit later, do it with a throwaway account.