What is the difference between a script and a notebook?
Replace this paragraph with 2-3 sentences describing your understanding of the difference between a script and a notebook. Your answer should be applicable to R or python (so if you discuss python notebooks, you should also discuss the equivalent in R). Use markdown formatting as described in this cheat-sheet.
You may want to provide a table or itemized list, and you should use code formatting to indicate file extensions and programming languages.
You can comment this prompt out, so that it does not show up in your document (but is still present in the qmd file) by highlighting the text and hitting Ctrl/Cmd + Shift + C.
Playing with Code in Notebooks
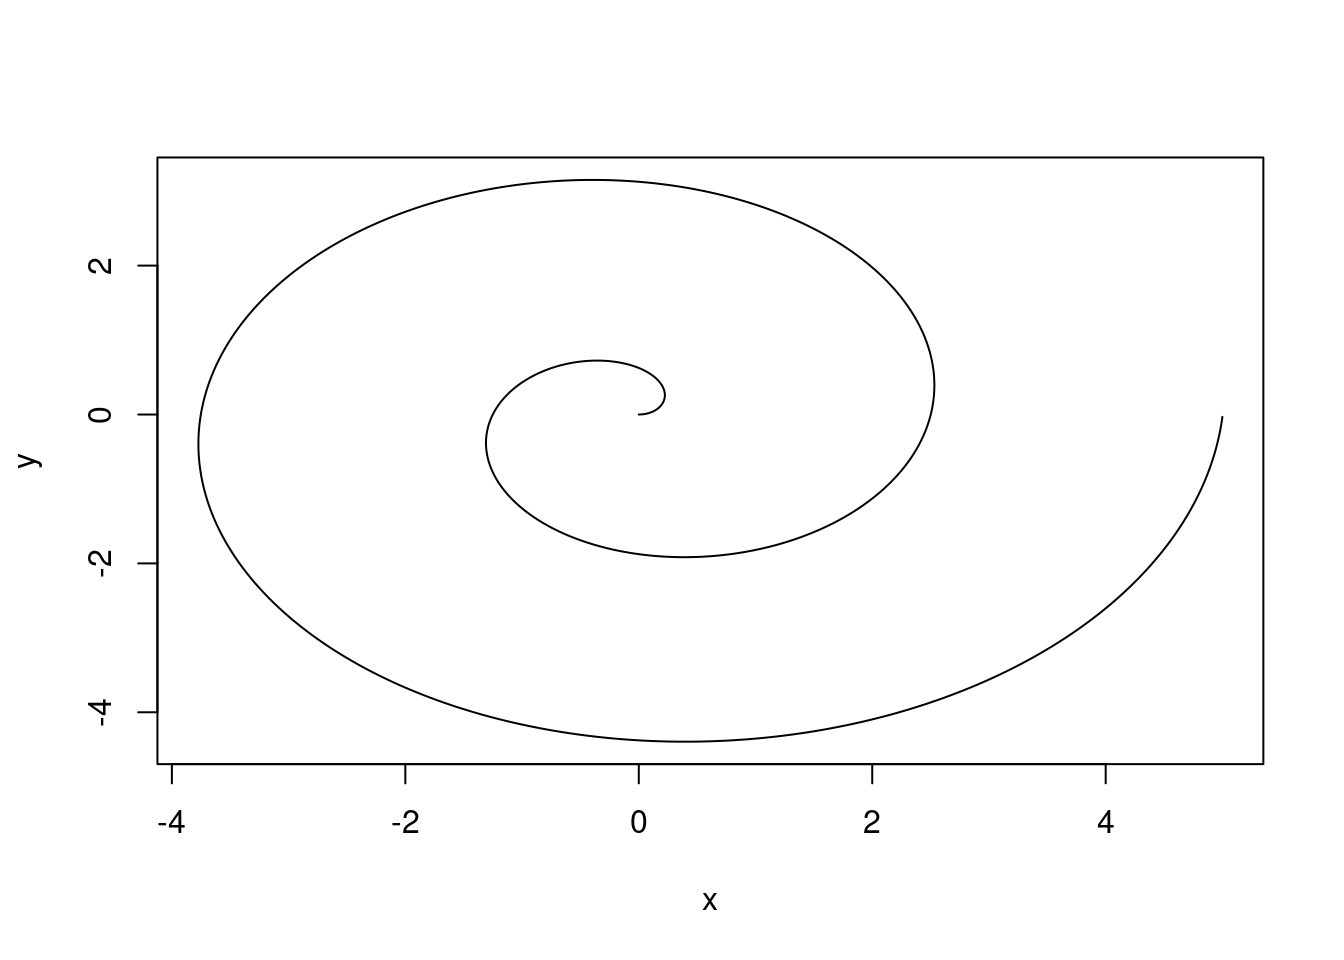
The code chunk below defines a logarithmic spiral. Using this reference, modify the code so that it now plots Fermat’s spiral. Use \(a = 1\).
# Define the angle of the spiral (polar coords)# go around two full times (2*pi = one revolution)theta <-seq(0, 4*pi, .01) # Define the distance from the origin of the spiral# Needs to have the same length as thetar <- theta# Now define x and y in cartesian coordinatesx <- r *cos(theta)y <- r *sin(theta)plot(x, y, type ="l")
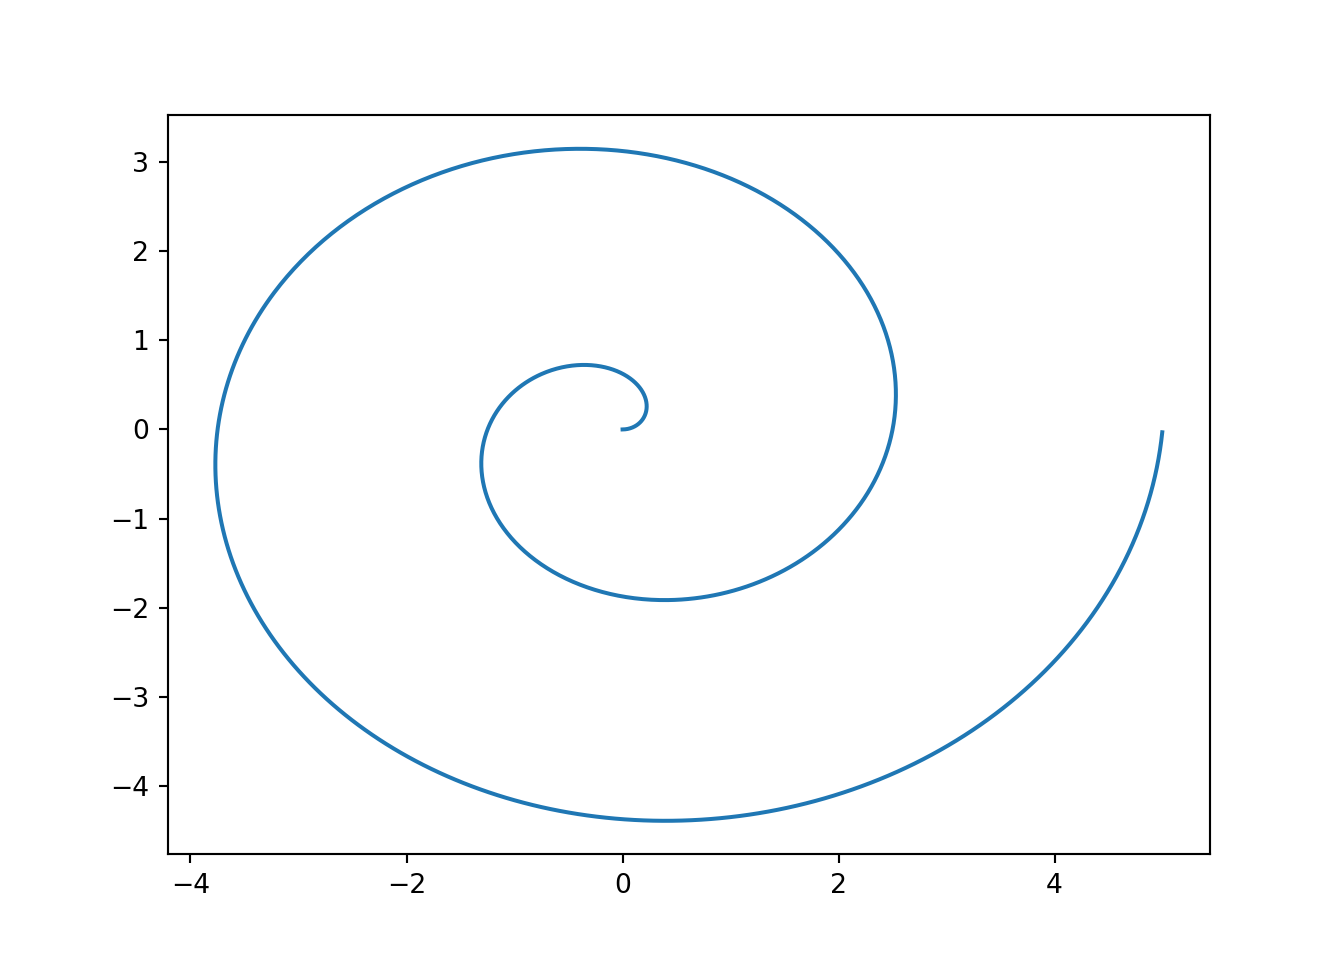
Can you do the same thing in Python? It may help to know that in Python, to raise something to a power, you use ** instead of ^.
import numpy as npimport matplotlib.pyplot as plt# Define the angle of the spiral (polar coords)# go around two full times (2*pi = one revolution)theta = np.arange(0, 4* np.pi, 0.01)# Define the distance from the origin of the spiral# Needs to have the same length as theta r = theta# Now define x and y in cartesian coordinatesx = r * np.cos(theta)y = r * np.sin(theta)# Define the axesfig, ax = plt.subplots()# Plot the lineax.plot(x, y)plt.show()