Organizing Information
Annual Review Article User Guide
For Wednesday: Submit a topic idea for your user guide
- Focus on practical implementation
- Show how to use some software or technique
Written for a peer at a business who is not necessarily a statistician but is technologically competent (you can assume knowledge of basic R/python)
Example: Conducting visual inference studies using the
nullaborpackage
Organizing Information
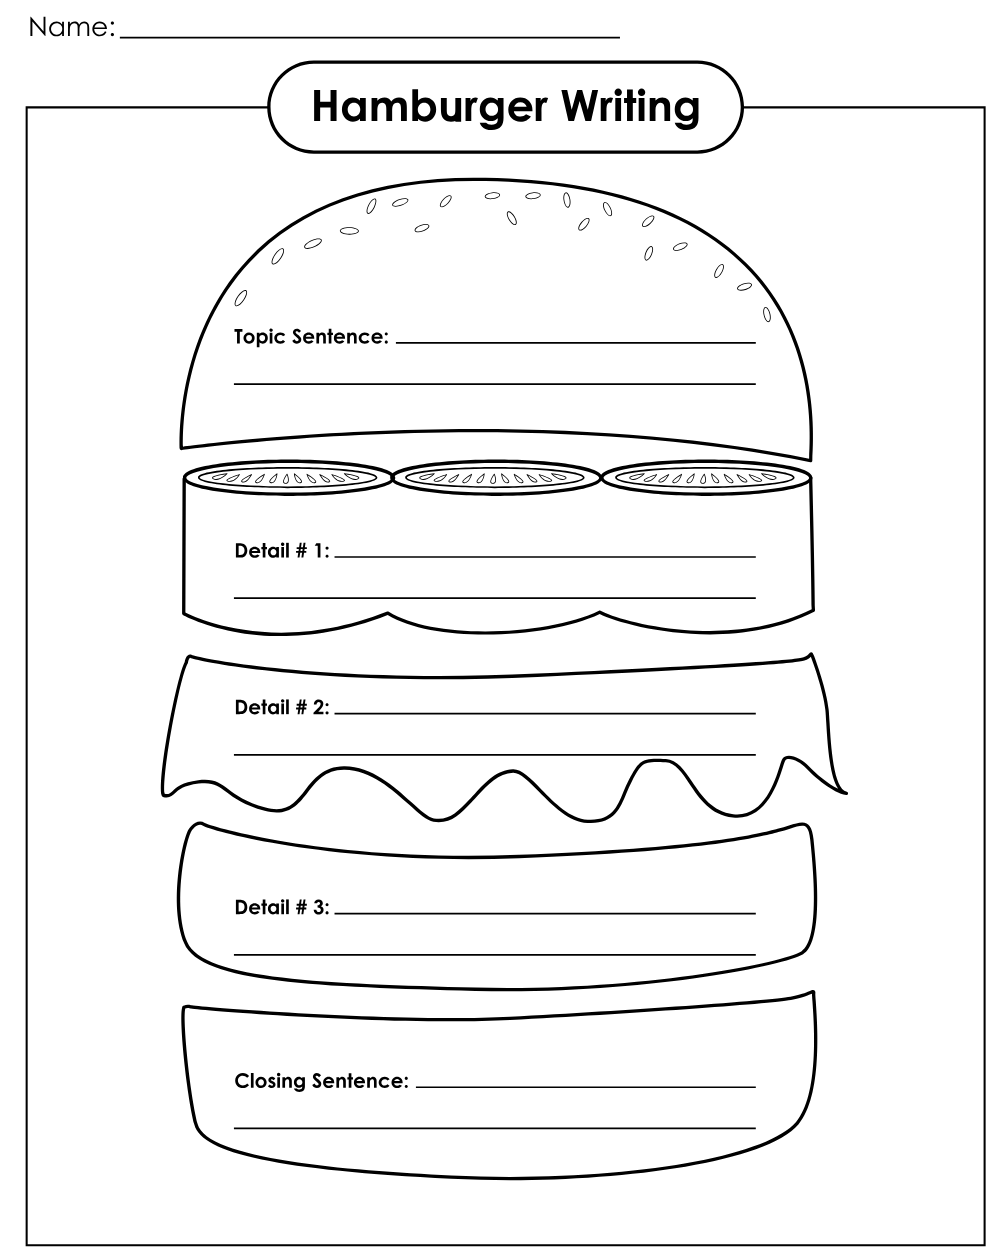
- Anyone remember this from elementary school?
Removing the Training Wheels
Thesis developed in parallel with the body of the essay
Feedback loop:
- initial thesis -> draft of the body
- discoveries while drafting the body -> update thesis
- updated thesis -> reshape the body
Removing the Training Wheels
- Continual refining of ideas until
- you’re happy
(OR) - the due date arrives
- you’re happy
Statistical Writing
Main types of statistical writing (in my experience):
Experiment write-up
White paper/Technical report
- Use a statistical analysis to make a point
Tutorial
Literature review
Organizing Information
Make a list of the main points
Make lists of supporting information for each main point
Move them around (Post its!) to see if you can find natural transitions
- time
- connecting pieces of information
- logical flow
Organizing Information
- If things don’t logically connect
- are you missing critical pieces to connect concepts? -> More research
- are you trying to do too much? -> Narrow topic/thesis
Activity
Build the document using the puzzle pieces I’ve given you.
Can you make them logically connect?
What features are you using to connect each piece?